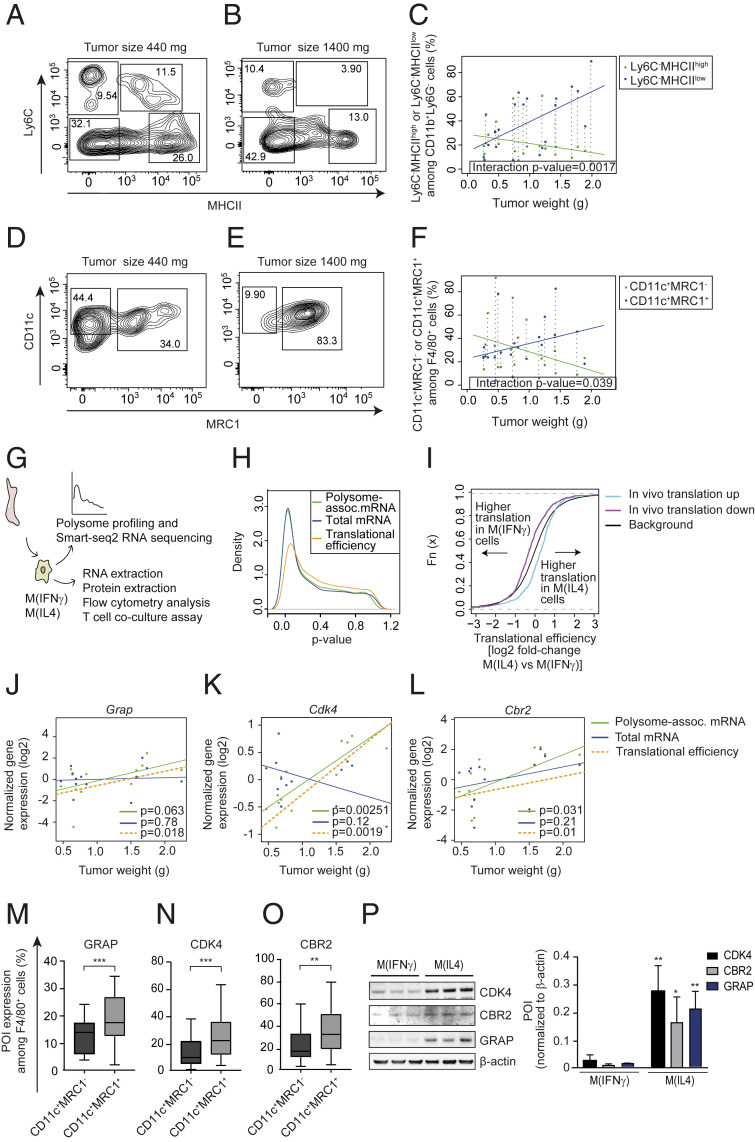
Fig. 2.
Tumor-weight-associated changes in translational efficiencies in TAMs are consistent with a shift from pro- to antiinflammatory TAMs. (A–F) Percentages of proinflammatory (CD11b+Ly6G−Ly6ClowMHCIIhigh in A and B and CD11b+F4/80+CD11c+MRC1− in D and E) and antiinflammatory (CD11b+Ly6G−Ly6ClowMHCIIlow in A and B and CD11b+F4/80+CD11c+MRC1+ in D and E) macrophages from PyMT tumors of different sizes (quantified by flow cytometry; n = 21). Representative plots of macrophages from a small (440 mg; A and D) and a large (1,440 mg; B and E) tumor together with the percentage of pro- and antiinflammatory macrophages as a function of tumor size across all analyzed tumors in C and F are shown. In C and F, the P value for an interaction between tumor weight and macrophage subtype is indicated together with the linear relationships between tumor size and percentage of pro- or antiinflammatory macrophages. Dotted vertical lines connect percentages of macrophage subtypes from the same tumor. (G) BMDMs were isolated and polarized into M(IFNγ) and M(IL4) in vitro followed by polysome profiling (n = 4). (H) Distributions (estimated using kernel densities) of P values for polarization-dependent changes in polysome-associated mRNA, total mRNA, and translational efficiencies (i.e., after anota2seq analysis). (I) Cumulative distribution functions of polarization-dependent fold changes in translational efficiencies for transcripts whose translation was activated (“translation up”) or suppressed (“translation down”) in TAMs during tumor growth in vivo (i.e., from Fig. 1). Such transcript subsets were compared to background (i.e., not in subsets) using the Wilcoxon rank-sum test (P value <0.001 for both subsets). (J–L) Tumor-weight-dependent changes in total mRNA, polysome-associated mRNA, and translational efficiency for Grap (J), Cdk4 (K), and Cbr2 (L). Points indicate normalized expression levels for polysome-associated mRNA (green) and total mRNA (blue) obtained from individual tumors (i.e., from Fig. 1) with their corresponding relationships to tumor weight from linear regressions. Shown is also the calculated linear relationship between translational efficiency (i.e., polysome-associated mRNA adjusted for total mRNA) and tumor weight (P values for weight-dependent expression are indicated). (M–O) PyMT tumor single cell suspensions were subjected to flow cytometry and the percentage of F4/80+CD11c+MRC1− and F4/80+CD11c+MRC1+ cells expressing GRAP (M), CDK4 (N), and CBR2 (O) proteins were quantified. Data are presented as mean ± SD. Student’s t test was used to compare expression between macrophage subtypes (n = 20, **P < 0.01, ***P < 0.001). (P) Expression of proteins of interest (POI) in whole cell extracts from M(IFNγ) and M(IL4) assessed by Western blotting. One out of three independent experiments is shown and the summary is presented as means + SD. Student’s t test was used to compare M(IFNγ) to M(IL4) for each POI (n = 3; *P < 0.05; **P < 0.01).

