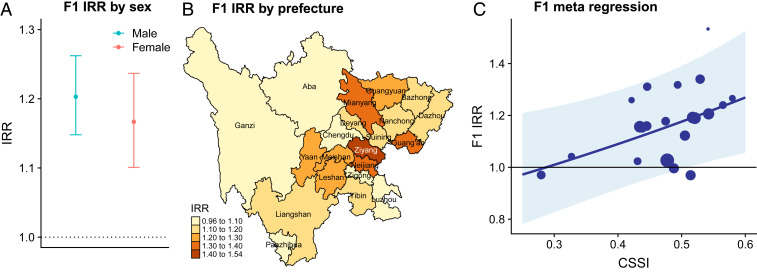
Fig. 4.
Impact of the Great Chinese Famine on active PTB risk in directly affected birth cohort (F1). (A) Province-level IRR by sex. (B) Spatial heterogeneity in prefecture-level IRR. Prefectures are colored according to their IRRs, with darker colors representing higher IRRs. (C) Scatterplot of CSSI and IRR of F1 across prefectures (dots). The size of the dot is proportional to the inverse variance of the estimated IRR of that prefecture. The line represents the metaregression fit, and the shaded area represents the 95% CI.

