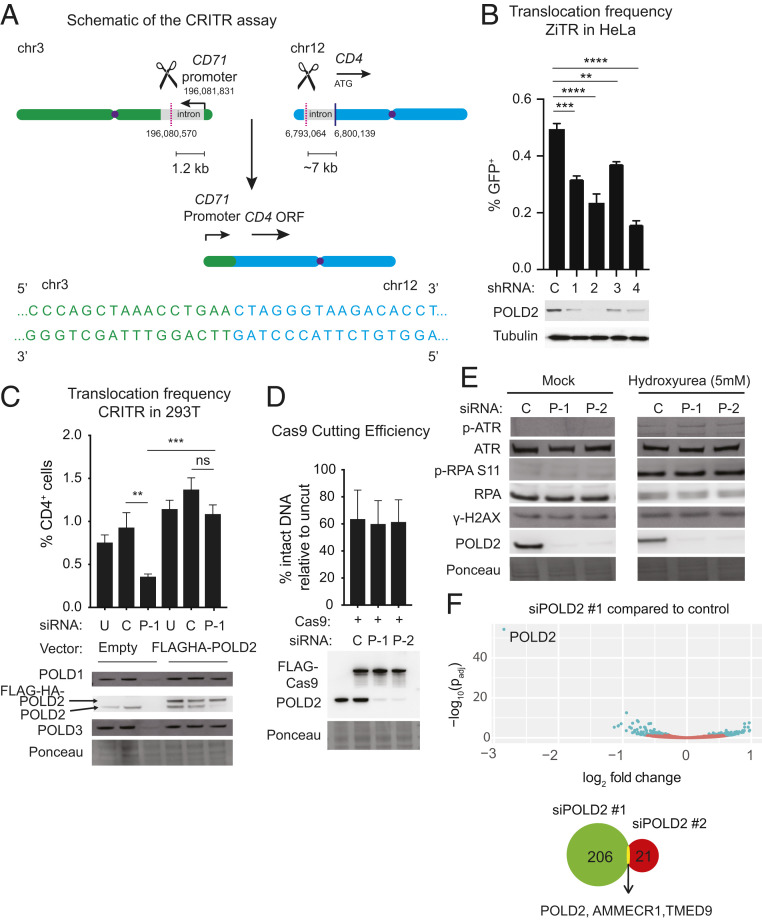
Fig. 1.
POLD2 promotes chromosomal translocations. (A) Schematic of the CRITR assay (30). (Upper) Endogenous CD71 and CD4 loci showing the orientation of the CD71 promoter and the CD4 ORF on human chromosomes 3 (chr3, green) and 12 (chr12, blue), respectively. Scissors and pink dotted line indicate CRISPR/Cas9 cut site. (Lower) Sequence of translocation junction without any end processing (referred to as “exact”). Translocation juxtaposes the CD71 promoter with the CD4 ORF leading to the expression of the CD4 gene, which is quantified by flow cytometry. Chromosome coordinates correspond to Human Dec. 2013 (GRCh38/hg38, University of California, Santa Cruz [UCSC] Genome Browser). (B) Validation of POLD2 as a genetic factor influencing chromosomal translocations by measuring translocation frequency 48 h after AAVS1 ZFN adenovirus infection into HeLa ZiTR cells (30) stably transduced with one of four different shRNA against POLD2 (1–4) or control (C). (C) Translocation frequency in CRITR assay using 293T cells stably transduced with siRNA-resistant FLAG-HA-POLD2 or empty vector. Cells were transfected with indicated siRNA and 72 h later transfected with the same siRNA and Cas9/gRNA. Cells were collected after 48 h for flow cytometry and immunoblotting. (D) Cas9 cutting efficiency at the CD4 locus. Cells were transfected with siRNA targeting POLD2 or control as in C and then harvested 24 h after Cas9/gRNA transfection for qPCR with primers across the CD4 cleavage site. (E) Immunoblotting in HeLa cells after exposure to vehicle or hydroxyurea (HU) for 24 h. In A–D, U, Untransfected; C, Control; P-1, siPOLD2 #1; P-2, siPOLD2 #2. Data are presented as mean ± SE (SE) of n = 3. P values calculated using a one-way ANOVA with Tukey’s correction. **P < 0.01, ***P < 0.001, ****P < 0.0001, ns, not significant. (F) Differentially expressed genes following siPOLD2 #1. Genes with differential expression (Padj < 0.05) are shown in blue; 206 genes were differentially expressed (P < 0.05) with siPOLD2 #1 relative to siCont and 21 genes were differentially expressed with siPOLD2 #2 relative to siCont. Venn diagram indicates overlap in genes differentially expressed across the two different POLD2 siRNA.

