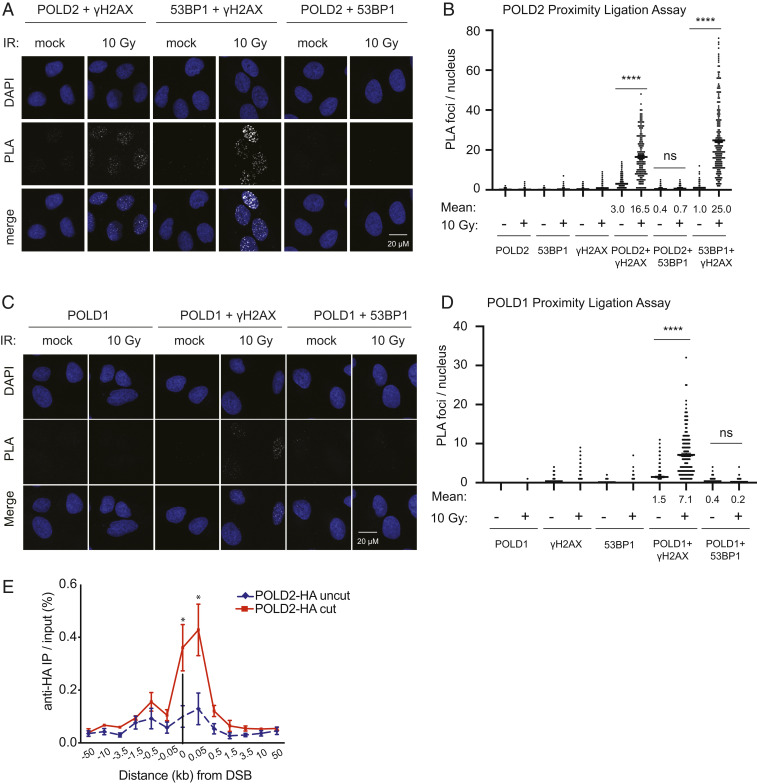
Fig. 4.
POLD localizes to DSBs. (A and B) PLA with antibodies against POLD2 and the indicated targets at 2 h following 10 Gy IR or mock treatment. Representative PLA panels (A) and quantification of PLA foci (B). (C and D) PLA with antibodies against POLD1 and the indicated targets as in A and B. More than or equal to 90 cells were imaged per condition per replicate. (E) HA-POLD2 occupancy at the AAVS1 locus 18 h after transient expression of ZFN by ChIP and quantitative PCR. Uncut, mock transfection; cut, AAVS1 ZFN. Data are presented as mean ± SE of n ≥ 2 independent experiments each performed in triplicate. P values for PLA calculated using a one-way ANOVA with Tukey’s correction. P values for ChIP calculated using Student’s t test, n = 4. *P < 0.05, ****P < 0.0001.

