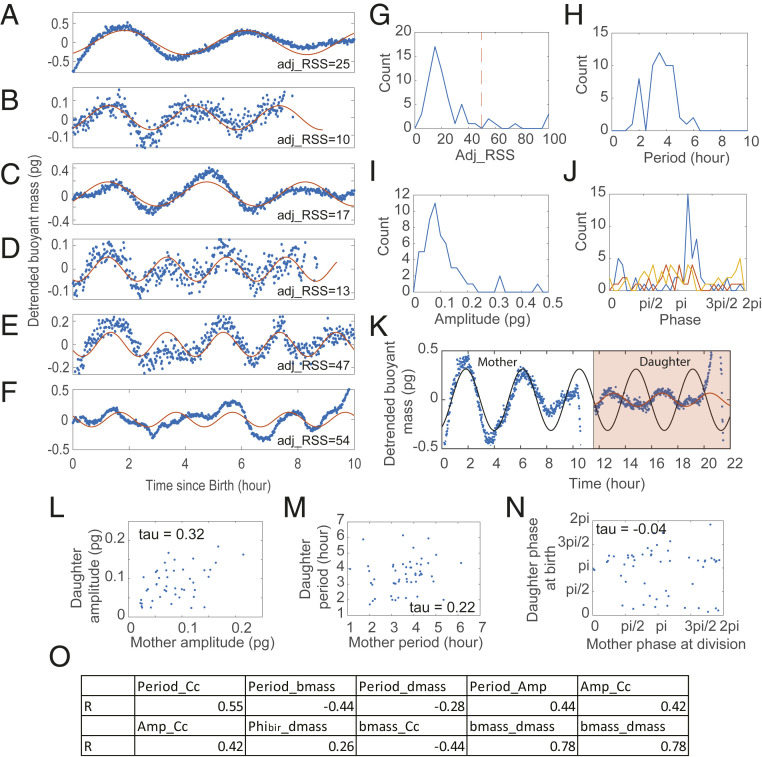
Fig. 5.
Detection of growth rate oscillations in individual L1210 lymphoblast cells measured by SMR. (A–F) Examples of randomly selected detrended buoyant mass trajectories (blue dots). The solid red lines are the fitted cosine functions. adj_RSS indicates the goodness of fit. (G–J) The distributions of adj_RSS (G), period (H), amplitude (I), and phase at different cell cycle events (J) of the fitted cosine functions. The red dashed line in G indicates the arbitrary cutoff threshold; the distributions in H–J only include the 56 cells below that threshold. The blue, red, and yellow lines in J represent the oscillation phase at birth, G1/S, and division, respectively. Note that only 38 cells were measured with the fluorescent FUCCI marker and had identified G1/S timing. (K) The detrended buoyant mass trajectory of an example L1210 cell continued with the trajectory of one of its daughters (blue dot). The black and red lines are the fitted cosine functions of the mother and daughter cell, respectively. (L–N) The mother–daughter correlation of the oscillation amplitude (L), period (M), and phase (N). The correlation coefficients were calculated as Kendall’s tau coefficient to avoid the effect of outliers. (O) The summary table of Pearson’s correlations of P value smaller than 0.05. Cc denotes cell cycle length; bmass denotes birth mass; dmass denotes division mass; Amp denotes amplitude; Phibir denotes the phase at birth.

