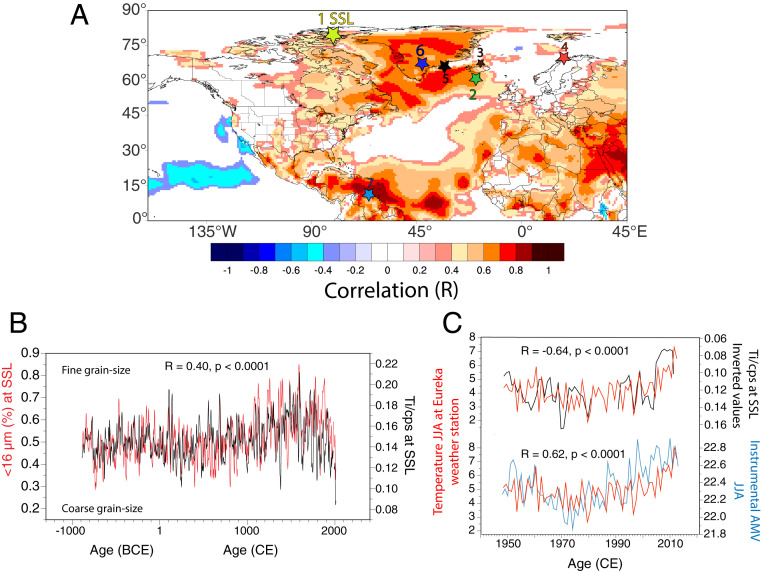
Fig. 1.
AMV during summer in the North Atlantic. (A) Spatial correlation between instrumental AMV and 2-m temperature from ERA-Interim (15) from 1979 to 2019. The numbering 1–7 corresponds to sites referred to in the text: SSL (1), Rapid-17–5P (2), A. islandica from bivalve shells (3), BWTs at Malagen (4), SIC in southeast Greenland (5), DYE-3 ice record (6), and G. bulloides abundance at Cariaco Basin (7). Map created using University of Maine Climate Reanalyzer, https://climatereanalyzer.org/. (B) Annually fine grain size (% <16 µm) (16) compared to Ti at SSL (cps: counts per second) over the past 2,900 y. Data are filtered by an 11-y Gaussian filter. (C, Upper) Comparison between SSL Ti (inverted values) and instrumental temperature (JJA, 3-y running mean) at Eureka weather station located 60 km northeast of SSL. (C, Lower) Same as Upper, but using the unsmoothed (and unaltered) instrumental AMV from Kaplan SST (17). Note that a turbidite dated to 1990 eroded 9 varves (16).

