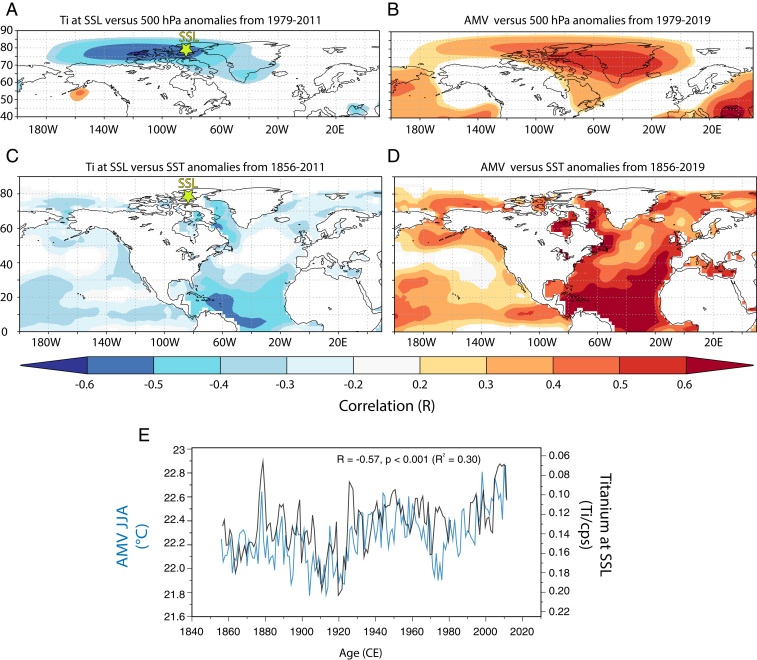
Fig. 2.
Ti variability at SSL and its relationship with instrumental AMV. (A) Map correlation between Ti variability and atmospheric pressure at 500 hPa from ERA-Interim (15) during summer (JJA) from 1979 to 2011. (B) Same as A but for the instrumental AMV (17) during summer (JJA) from 1979 to 2019. (C and D) Same as A and B but Ti at SSL (1856–2011) and instrumental AMV (1856–2019) correlated to SST anomalies from the Extended Reconstructed Sea Surface Temperature, version 5 (28). (E) Comparison between Ti at SSL (inverted values) and the instrumental summer (JJA) AMV over the instrumental period 1856–2011 (17). Yellow star (A and C) denotes the location of SSL record.

