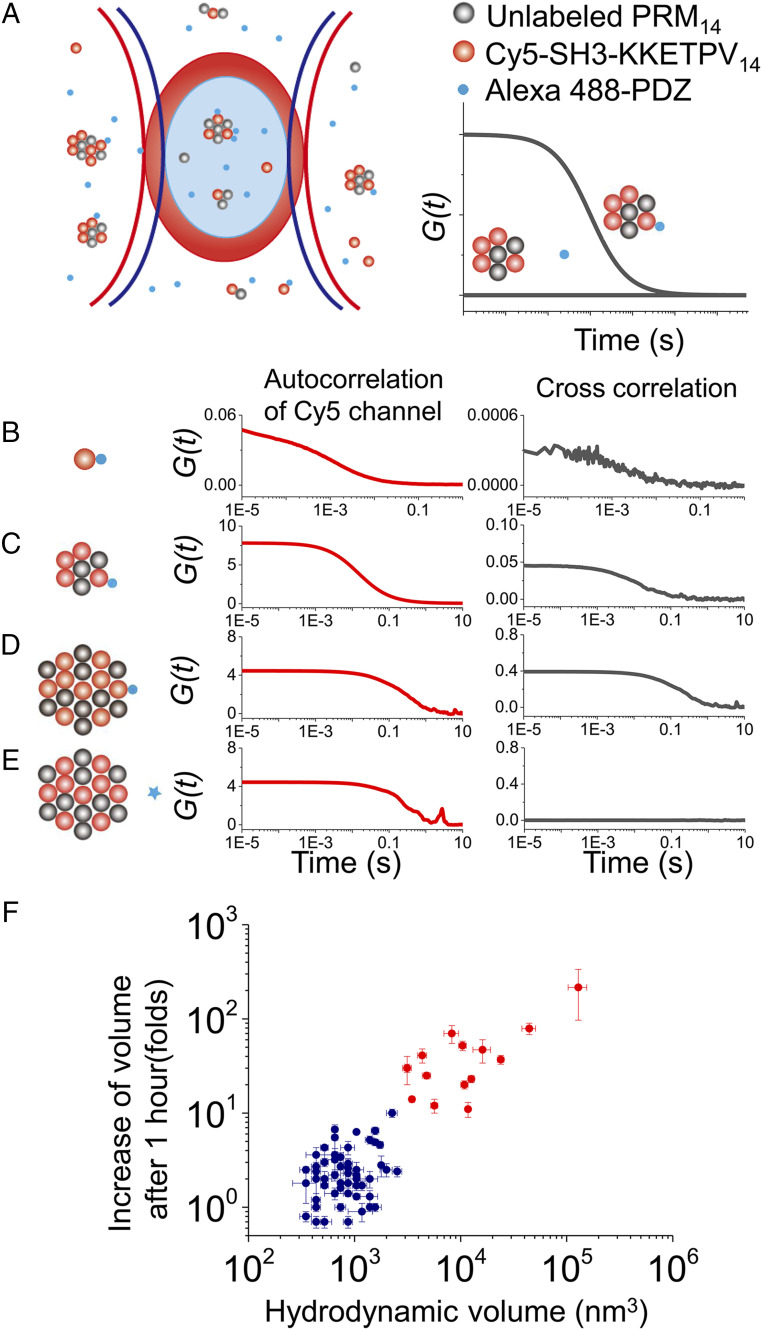
Fig. 3.
Quantification of client molecule recruitment and clustering analysis. (A) Scheme of dcFCCS assay. The presence of complexes containing both Alexa 488-PDZ (blue dots) and Cy5-(SH3-KKETPV)14 (red dots) contributes to positive correlation in dcFCCS curves, whereas no interaction between Alexa 488 labeled and Cy5 labeled molecules leads to a flat dcFCCS curve showing no correlation. (B–E) Autocorrelation curves of Cy5 intensity (red) and dcFCCS curves between Alexa 488 and Cy5 intensities (black) under different conditions, which were 200 nM Cy5-(SH3-KKETPV)14 without PRM14 (B), 200 nM Cy5-(SH3-KKETPV)14 with 400 nM PRM14 (C), and 2 μM Cy5-(SH3-KKETPV)14 with 4 μM PRM14 (D and E). Two hundred nM Alexa 488-PDZ (B–D) or 200 nM Alexa 488 labeled elongation factor G (E, negative control) was used. (F) Clustering analysis using hydrodynamic volumes of heterocomplexes right after mixing and increasing of volumes after 1-h incubation.

