Fig. 1.
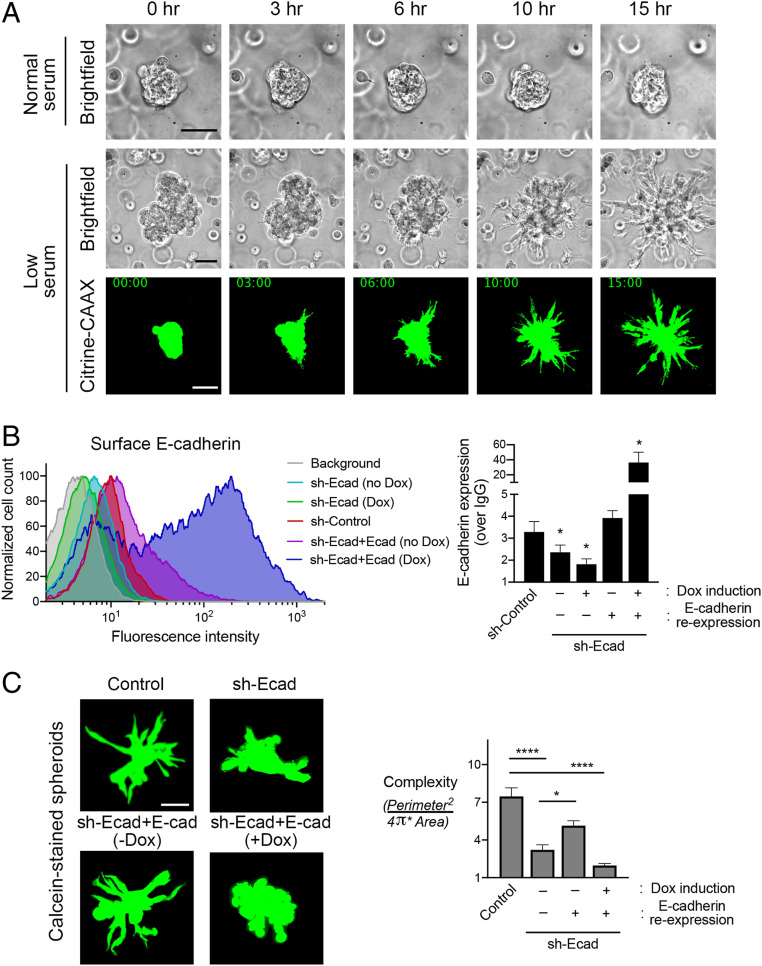
MDA-MB-231 spheroids collectively invade into Matrigel upon serum withdrawal. (A) Time-lapse imaging of MDA-MB-231 spheroids embedded in 3D Matrigel. Spheroids were grown and embedded in normal serum (10% fetal bovine serum [FBS]) and switched, or not, to low serum (0.1% FBS) about 4 h after embedding. Time points indicate duration after serum switch. Spheroids of parental cells were visualized with bright-field illumination (Upper). Spheroids of cells expressing Citrine–CAAX were visualized with fluorescence microscopy (Bottom). (Scale bar, 75 μm.) (B) Detection of surface E-cadherin levels through flow cytometry. Example of flow cytometry data (Left) and quantification from the indicated cell lines from n = 3 independent experiments (Right). Background fluorescence (upon staining with IgG) was used to normalize E-cadherin (Ecad) expression. Doxycycline (Dox) was used at 0.1 μg/mL. *P values of 0.048, 0.057, and 0.015, from left to right, by ANOVA with Dunnett’s multiple comparisons test against the sh-Control sample. (C) Calcein-stained spheroids of the indicated cell lines embedded in Matrigel, after overnight exposure to low serum (Left). Corresponding complexity values (Right). n = 15 to 24. *P < 0.05, ****P < 0.0001 by ANOVA with Dunnett’s T3 multiple comparisons test. Error bars show SE. (Scale bar, 75 μm.)

