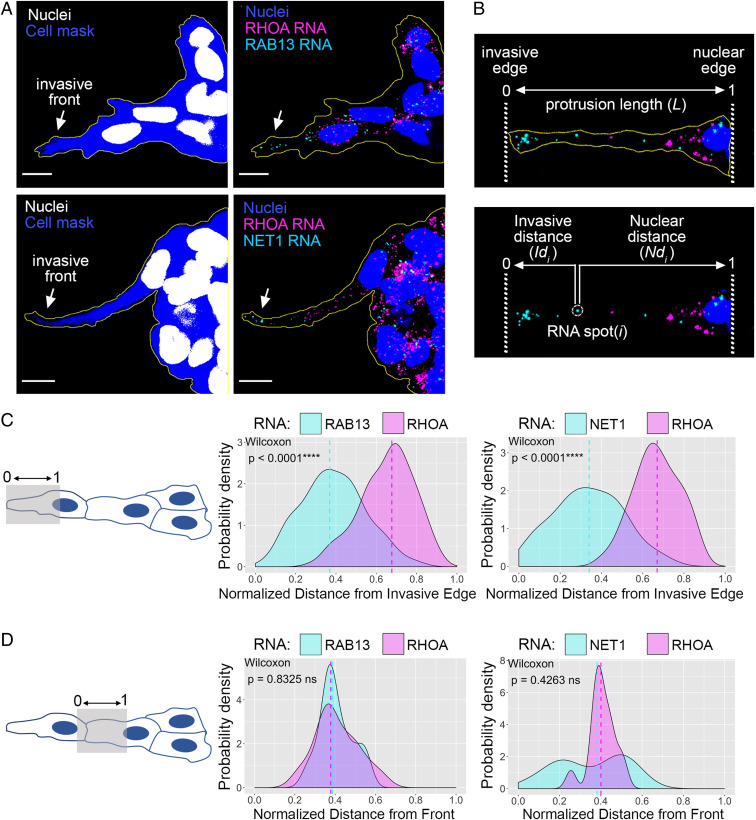
Fig. 2.
RAB13 and NET1 RNAs localize at the front of invasive leader cells. (A) In situ hybridization of invasive MDA-MB-231 spheroids in Matrigel. The indicated RNAs were detected, and cell mask staining was used to delineate the spheroid outline. Arrows point to RAB13 and NET1 RNA accumulation at the invasive front. (Scale bar, 10 μm.) (B) Representative image of the front cytoplasm of a leader cell used for quantitative analysis. Invasive and nuclear edges are manually defined, and for each RNA spot i, its distance from the invasive edge (Idi) and nuclear edge (Ndi) is obtained. The total protrusion length (L) is derived by summing Idi and Ndi. For each RNA species (e.g., RAB13 or RHOA) the average RNA distance is then computed and normalized between values of 0 (invasive edge) and 1 (nuclear edge) (see Materials and Methods for details). (C) Quantification of RNA distributions within the front cytoplasm of leader cells (shaded area in Left schematic). Average distance values, calculated as described in B, were used to derive the probability density function of the indicated RNAs. The RHOA RNA is used as an internal control in each case. n = 125 (RAB13-RHOA), n = 42 (NET1-RHOA); from a minimum of three independent experiments. (D) Analysis as in C focusing on the cytoplasm between the leader and follower cell nuclei (shaded area in Left schematic). Note that because in some images the rear cytoplasm of the leader cell is included in the analysis, this can skew the values toward the front, as noticeably seen in the Right graph. Comparisons are performed against the internal control RHOA RNA, which is detected in the same cells and is subject to the same segmentation limitations. n = 25 (RAB13-RHOA), n = 14 (NET1-RHOA); from a minimum of three independent experiments. P values determined by the Wilcoxon signed-rank test; ns, not significant.

