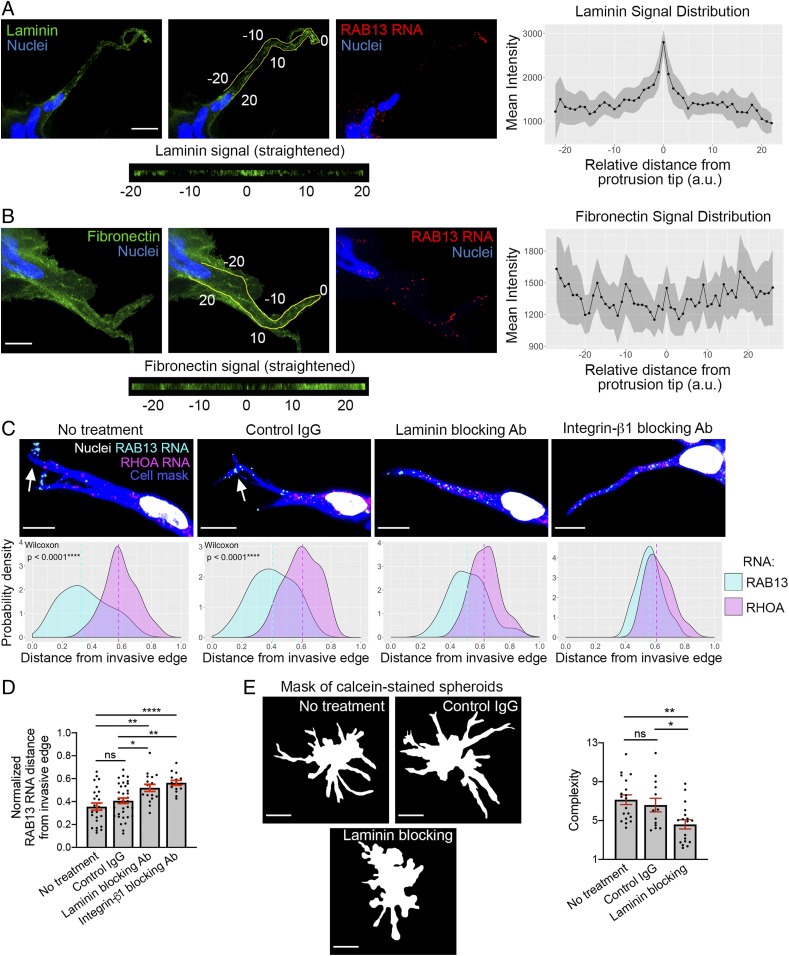
Fig. 4.
Laminin accumulation and engagement at the invasive front promote RNA localization. (A) Laminin distribution around leader cells of invasive spheroids. (Left image panels) Laminin immunostaining and RAB13 RNA detection focusing on a leader cell. The middle panel on the Left depicts the perimeter along the front cytoplasm used to quantify laminin intensity; 0 indicates the tip of the leader cell protrusion. The corresponding signal is presented straightened in the Bottom. (Scale bar, 15 μm.) (Right graph) Mean laminin intensity along the perimeter of leader cells. Distances are relative to the tip, which is set at 0. Shaded area indicates 95% CI. n = 23. (B) Fibronectin distribution around leader cells. Analysis as in A. n = 28. (Scale bar, 10 μm.) (C) Representative in situ hybridization images detecting RAB13 and RHOA RNAs within leader cells of invasive spheroids treated with the indicated blocking antibodies for 3 h. (Scale bar, 10 μm.) Associated probability density plots are derived from n = 16 to 36 images. P values determined by the Wilcoxon signed-rank test. (D) Comparison of normalized RAB13 RNA distances. (E) Calcein-stained spheroids treated overnight with the indicated antibodies and corresponding complexity values. n = 13 to 20. *P < 0.05, **P < 0.01, ****P < 0.0001; ns, nonsignificant by ANOVA with Tukey’s multiple comparisons test. Error bars show SE. (Scale bar, 70 μm.)

