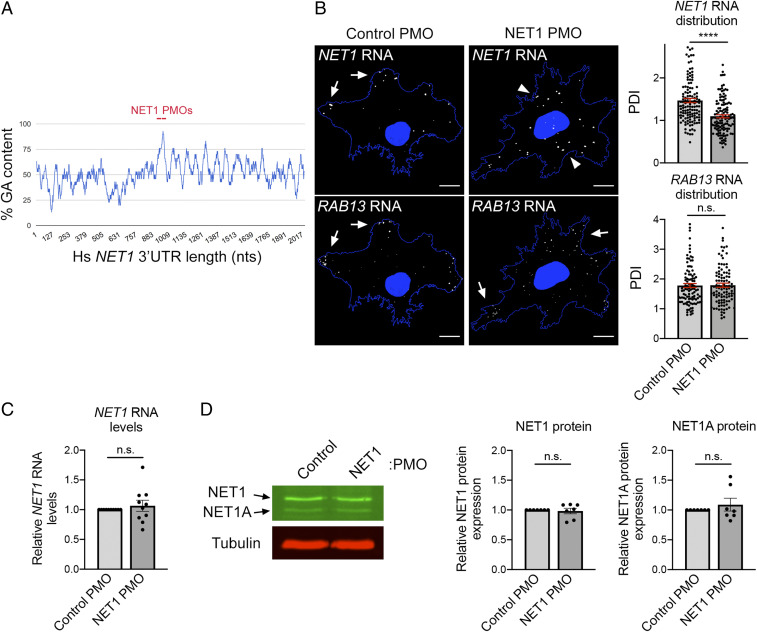
Fig. 5.
Antisense oligonucleotides against a GA-rich region in the NET1 3′UTR specifically interfere with the localization of NET1 RNA. (A) Schematic showing the percent GA content along the human NET1 3′UTR (using a 30 nucleotide [nt] window size) and the positions targeted by antisense PMOs. (B) FISH images of NET1 and RAB13 RNAs in cells treated with the indicated PMOs on a 2D surface. Arrows indicate peripheral RNA; arrowheads indicate perinuclear RNA. Corresponding graphs depict Peripheral Distribution Index (PDI) values measuring peripheral RNA distribution. A PDI value of 1 indicates a diffuse distribution. Note that the NET1 RNA becomes more perinuclear in cells treated with NET1 PMOs, while the RAB13 RNA remains peripherally localized. (Scale bar, 15 μm.) (C) NET1 RNA levels measured by droplet digital PCR (ddPCR) analysis. (D) Representative Western blot analysis to assess NET1 protein levels and corresponding quantifications. Note that two NET1 isoforms exist (NET1 and NET1A). ****P < 0.01; ns, nonsignificant by the Mann–Whitney U test (B) or Wilcoxon signed-rank test (C and D).

