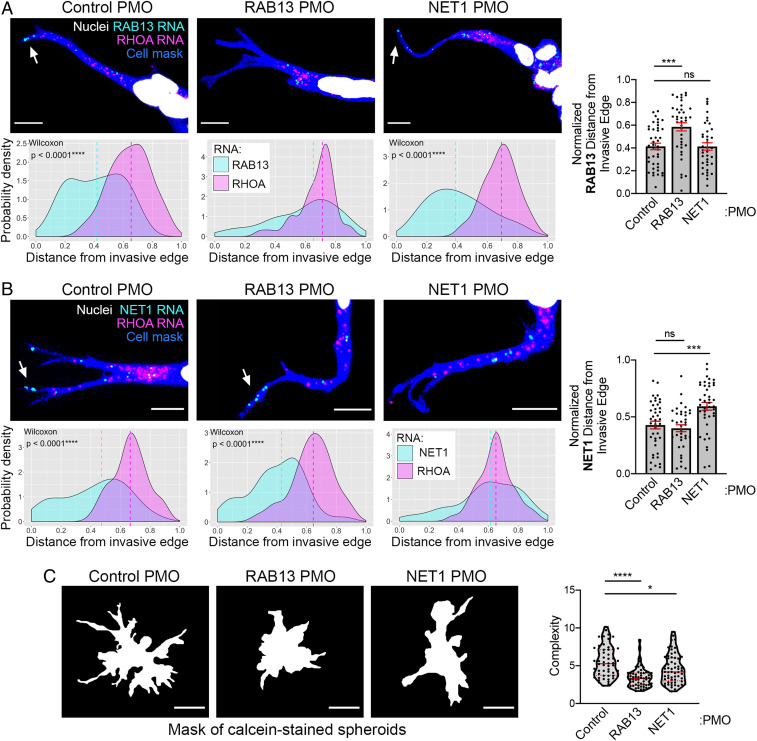
Fig. 6.
RAB13 and NET1 RNA localization at the invasive front is required for collective invasion. (A and B) Representative in situ hybridization images detecting RAB13 and RHOA RNAs (A) or NET1 and RHOA RNAs (B) within leader cells of invasive spheroids treated with the indicated PMOs. (Scale bar, 10 μm.) Associated probability density plots are derived from n = 37 to 42 images, three independent experiments. P values determined by the Wilcoxon signed-rank test. If not indicated, then differences are not significant. Right graphs depict comparison of normalized RAB13 RNA (A) or NET1 RNA (B) distances between PMO-treated spheroids. (C) Calcein-stained spheroids treated with the indicated PMOs and corresponding complexity values. (Scale bar, 70 μm.) n = 56 to 63, three independent experiments. *P <0.05, ***P < 0.001, ****P < 0.0001; ns, nonsignificant by the Kruskal–Wallis with Dunn’s multiple comparisons test (A and C) or ANOVA with Dunnett’s multiple comparisons test (B). Error bars show SE. Red lines in violin plots indicate median and quartile values.

