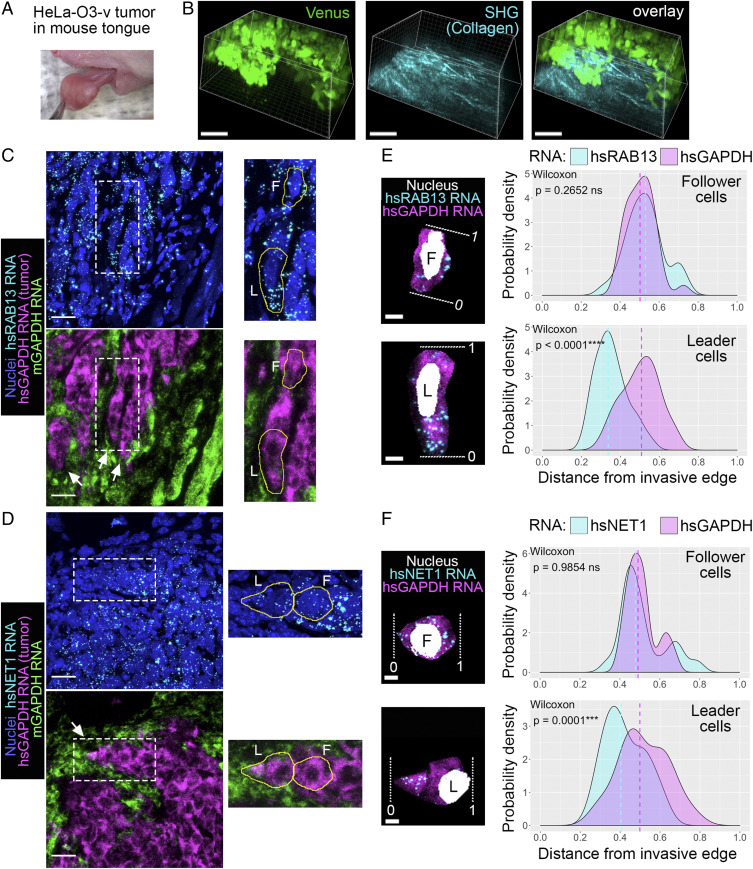
Fig. 7.
RAB13 and NET1 RNAs accumulate at potential invasive sites in in vivo tumors. (A) Xenograft tumor mass of HeLa-O3-v cells 2 wk after injection in a mouse tongue. (B) Intravital fluorescence imaging of tumor mass. Tumor cells are visualized through Venus fluorescence. Collagen fibers are visualized through second-harmonic generation (SHG). (Scale bars, 100 μm.) (C and D) Tongue tissue sections (20 μm thick) were processed to detect the indicated RNAs. Species-specific GAPDH RNA probes were used to delineate the tumor cells (hsGAPDH) from the normal mouse tissue (mGAPDH). White arrows point to potential invasive strands of tumor cells. Insets are magnified to the Right with leader (L) and follower (F) cells outlined. (Scale bars, 20 μm.) (E and F) Isolated leader and follower cells indicated in C and D. White dashed lines indicate the invasive front (0; for the follower cell, 0 indicates the edge facing toward the invasive front) or the rear of the cell (1). Probability density plots of indicated RNA distributions are derived from n = 29 cells (RAB13) or n = 20 cells (NET1) from two animals. P values determined by Wilcoxon signed–rank test; ns, not significant. (Scale bars, 5 μm.)

