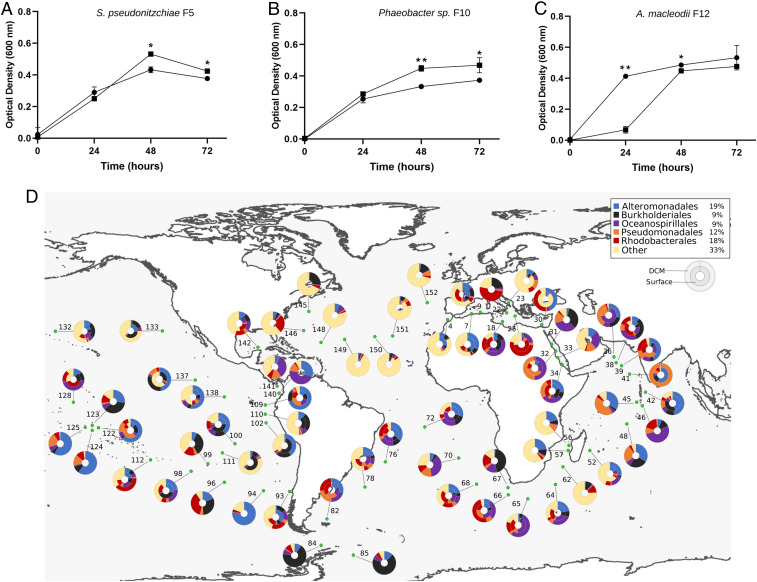
Fig. 5.
Azelaic acid inhibits growth of A. macleodii F12 and promotes growth of Roseobacters. Growth of (A) S. pseudonitzschiae F5, (B) Phaeobacter sp. F10, and (C) A. macleodii F12 on 10% marine broth supplemented with 100 µM azelaic acid (squares) compared to controls (circles). Error bars represent SD of three replicates. Significance was determined by Student’s t test: *P < 0.05 and **P < 0.001. (D) Bacterial response to azelaic acid is geographically widespread throughout the oceans. The relative abundance of reads of the azelaic acid transcriptional regulator, AzeR, in the Tara Oceans database is 0.03%. The total percentage abundance of AzeR homologs according to their taxonomic distribution is shown in the top right box. Rhizobiales makes up the majority of hits (39%) in the “other” group. The color-coded donut plots represent the percentage taxonomic abundance of AzeR homologs from all size fractions (0 to 3 μm) at the surface (inner circle) and deep chlorophyll maximum (outer circle) from the Tara Oceans Microbiome Reference Gene Catalog. Numbers refer to the Tara Oceans stations; single donut plots depict surface samples only.

