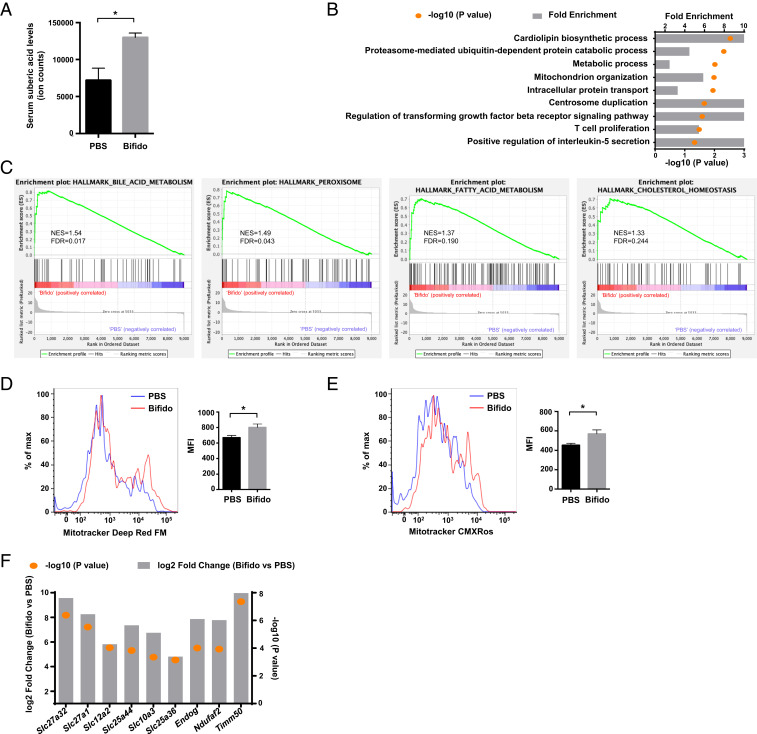
Fig. 4.
Bifidobacterium affects the mitochondrial metabolism of colon Tregs. (A) Concentrations of suberic acid in the serum of mice treated with PBS or Bifidobacterium. *P < 0.05. (B) GO analysis of significantly impaired biological processes. (C) GSEA of colon Tregs. The diagram plots GSEA for four gene sets up-regulated in Bifidobacterium-treated groups (left side, Bifidobacterium; right side, PBS). The vertical axis in the upper graph indicates the enrichment score (ES) for genes in each gene set. The barcode plot indicates the position of genes in each gene set. NES, normalized ES; FDR, false discovery rate. (D) Mitochondrial mass of colon LP Tregs (n = 5), as detected by MitoTracker Deep Red FM labeling and flow cytometry. *P < 0.05. (E) Mitochondrial stress of colon LP Tregs (n = 5), as detected by MitoTracker Red CMXROS labeling and flow cytometry. *P < 0.05. (F) Mitochondria-related gene expression pattern in Bifidobacterium-treated vs. PBS-treated LP Tregs.

