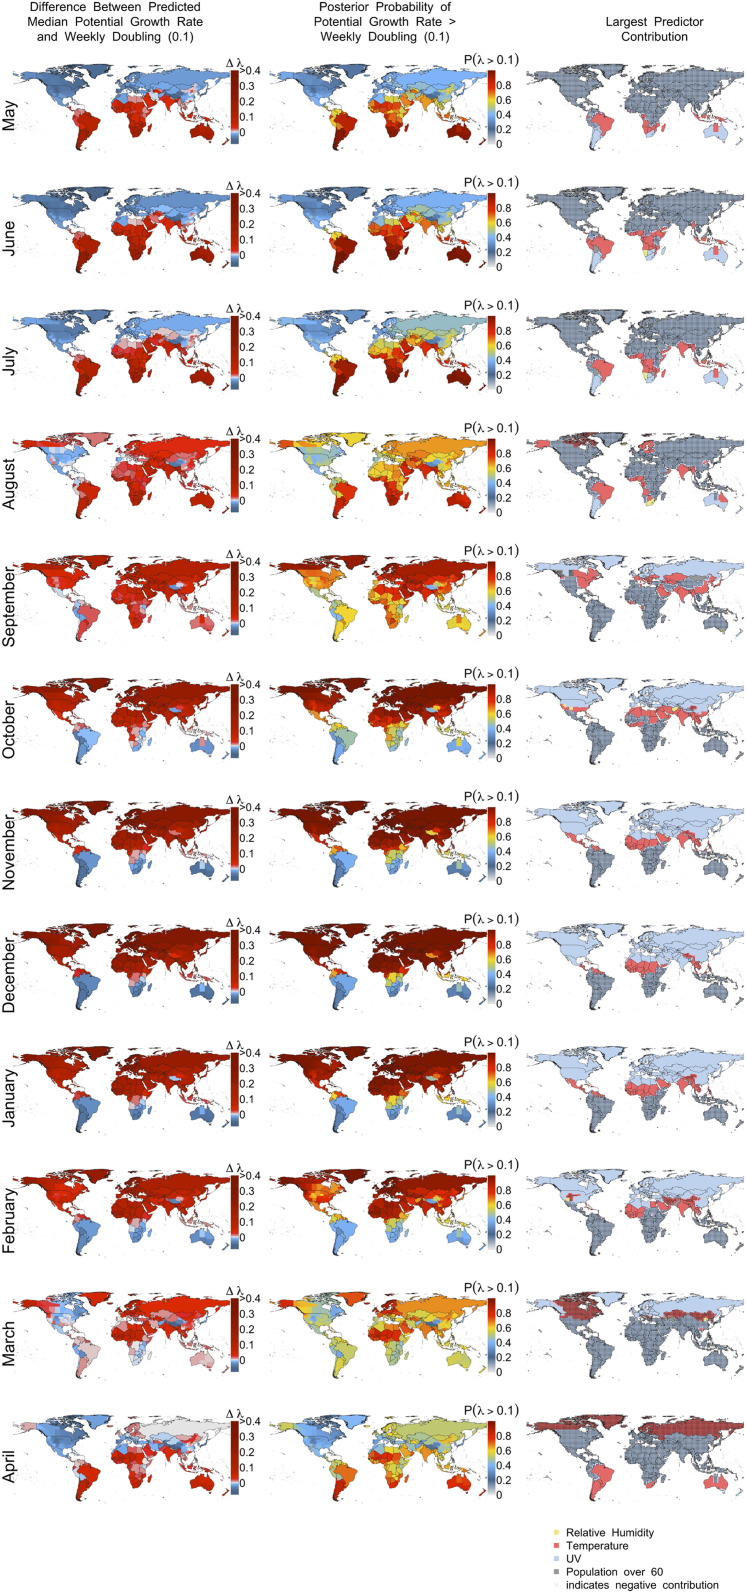
Fig. 4.
Predicted potential growth rates of COVID-19 by month using best model. (Left) Potential growth rate relative to weekly doubling time (λ = 0.1). Red indicates faster than a weekly doubling rate, and blue indicates slower rates. (Middle) Posterior probability of growth rates exceeding a weekly doubling rate. (Right) Indicates which predictor contributes most (based on predictor × coefficient) to COVID-19 growth rate (λ) in each 0.25° cell, with stippling indicating negative contributions.

