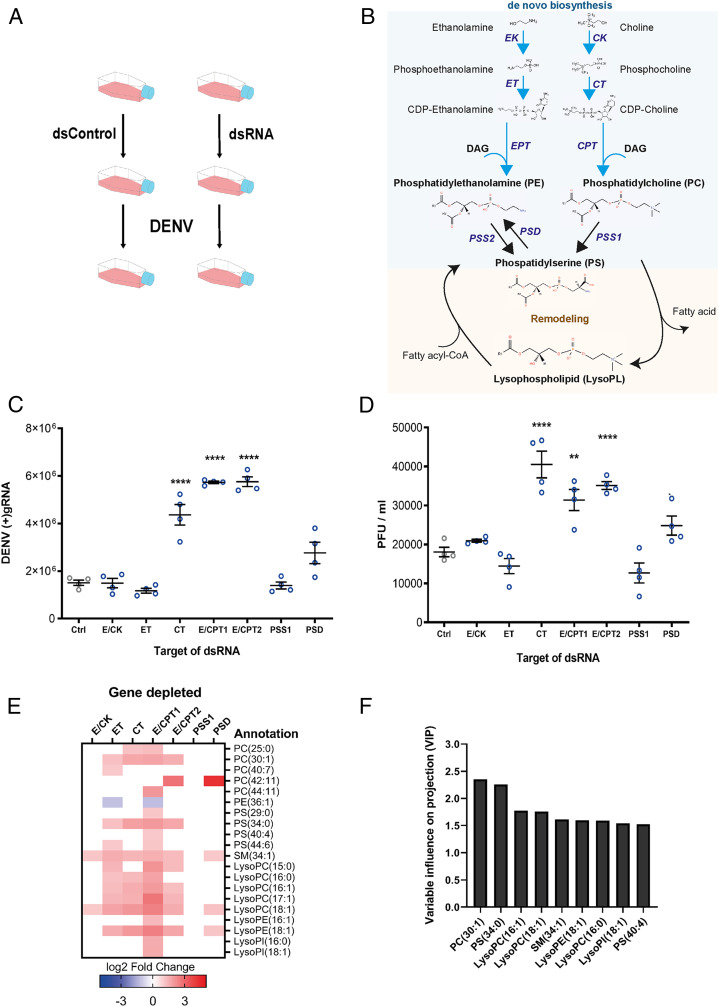
Fig. 1.
Impact of de novo PL pathway disruptions on DENV and PL reconfiguration. Aag2 cells were transfected with dsRNA targeting different enzymes of the de novo pathway or control dsRNA (Ctrl). Twenty-four hours later, cells were infected with DENV at a MOI of 1. Samples were collected at 48 hpi. (A) Experimental design. (B) Scheme of the PL de novo and remodeling pathways. Ethanolamine and choline are phosphorylated by E/CK and then integrate a cytidine diphosphate group by CTP–ethanolamine or CTP–phosphocholine cytidyltransferases (ET or CT). The CDP–ethanolamine and CDP–choline formed incorporate a DAG by DAG:CDP–ethanolamine ethanolaminephosphotransferase (EPT) or DAG:CDP–choline cholinephosphotransferase (CPT) to produce PE and PC, respectively. In mosquitoes, EPT and CPT catalyze both PE and PC and were named E/CPT. PS is produced by a head exchange reaction from PC or PE by PSS. PE is reversely produced by PSD. PL remodeling starts with deacylation by PLA2 to produce LysoPLs. LysoPLs are then reacylated by lysophospholipid acyltransferase via incorporation of another fatty acid to form a new PL species. (C and D) Impact of gene depletions on DENV (+)gRNA copies in cells (C) and on PFUs in supernatants (D). Lines show mean ± SEM from four biological repeats. **P < 0.01; ****P < 0.0001 as determined by Dunnett’s multiple comparison test. (E) DENV-induced phospholipidome reconfiguration upon enzyme depletion. Fold changes of annotated and significantly regulated metabolites (|log2 fold change| > 1 and P < 0.05) for each depleted enzyme compared to dsRNA control from three biological repeats. (F) VIP for each metabolite. Bars show VIP score > 1.5 as determined by PLS analysis with DENV production (PFU/mL) as the response variable and metabolite concentrations as predictors.

