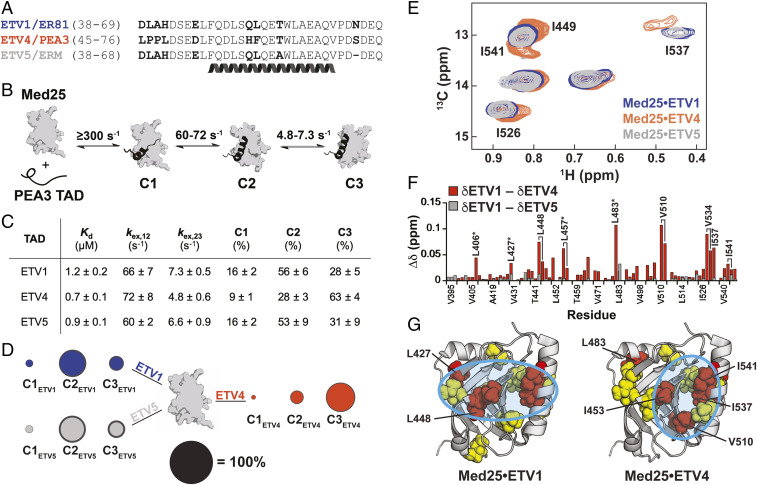
Fig. 2.
ETV/PEA3 activators differentially engage with Med25. (A) Alignment of ETV/PEA3 family activation domains. The helix denotes the residues that undergo coupled folding and binding with Med25, as determined by NMR chemical shift analysis (30). (B) Mechanism of binding of ETV/PEA3 activators to Med25, determined here for ETV1 and ETV4, and previously for ETV5 (32). The range of exchange rates between analogous steps for ETV/PEA3 TADs are shown. (C) Table of relevant binding parameters for each ETV/PEA3 TAD, including the equilibrium affinity, exchange rates between C1 and C2 (kex,12) and between C2 and C3 (kex,23), and equilibrium populations of each state. All values represent the average of three to four biological replicates, and the error is the SD. (D) Equilibrium populations of the three ETV/PEA3•Med25 conformations scaled relative to the diameter of the black circle. SDs of the values are shown as the dark gray outer circle. (E) Overlay of the Ile Cδ region of the 1H,13C-HSQC of Med25 in complex with 1.1 equivalents unlabeled ETV1 (blue), ETV4 (orange), or ETV5 (gray). Peaks that have chemical shift differences between complexes are labeled. Note: I449 and I541 form a single overlapped peak for the ETV1 and ETV5 complexes. Full spectra are in the supporting information. (F) Chemical shift differences of Med25 methyl resonances between ETV1 and ETV4 (orange) and ETV1 and ETV5 (gray). (G) Chemical shift perturbations induced by binding of ETV/PEA3 activators plotted on the structure of Med25 (PDB ID 2XNF) (34). Yellow = 0.040 to 0.080 ppm, red > 0.080 ppm. Cyan circles highlight general distinctions in perturbation patterns. Several residues with chemical shift differences >0.030 ppm between the ETV1•Med25 (or ETV5•Med25) and ETV4•Med25 complexes are labeled.

