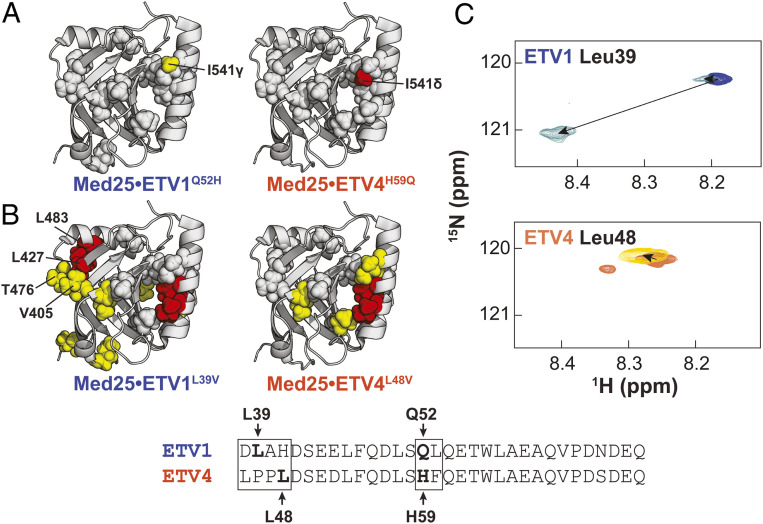
Fig. 4.
ETV/PEA3 variable regions engage in unique interactions with the Med25 surface. Effects of conservative mutations in the (A) helical binding region and (B) N termini are plotted on the structure of Med25. Yellow = 0.015 to 0.030 ppm, red ≥ 0.030 ppm. Residues discussed in the text are labeled. Gray spheres denote residues that undergo identical perturbations in both parent and mutant complexes. Residues chosen for mutation are bolded and labeled in the alignment. (C) Chemical shift perturbations of 150 µM ETV1 (Top) and ETV4 (Bottom) TADs in the absence (blue and orange, respectively) and presence (light blue and maroon, respectively) of 280 µM unlabeled Med25. TADs were selectively 15N labeled at the positions noted. Small secondary peaks in free ETV4 spectra were observed and likely arose from isomerization of the two tandem Pro residues in the N-terminal region.

