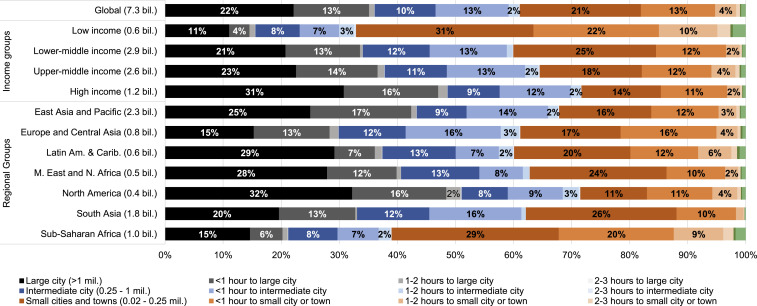
Fig. 2.
Global population distribution across the urban–rural continuum in 2015 and by country income and regional groups. Percentage of total population in different city sizes or in proximate areas of different travel times to these cities was obtained by aggregating across catchment areas. Economic development is expressed as per capita gross national income. Latin Am. & Carib., Latin America and the Caribbean; M. East and N. Africa, Middle East and North Africa.

