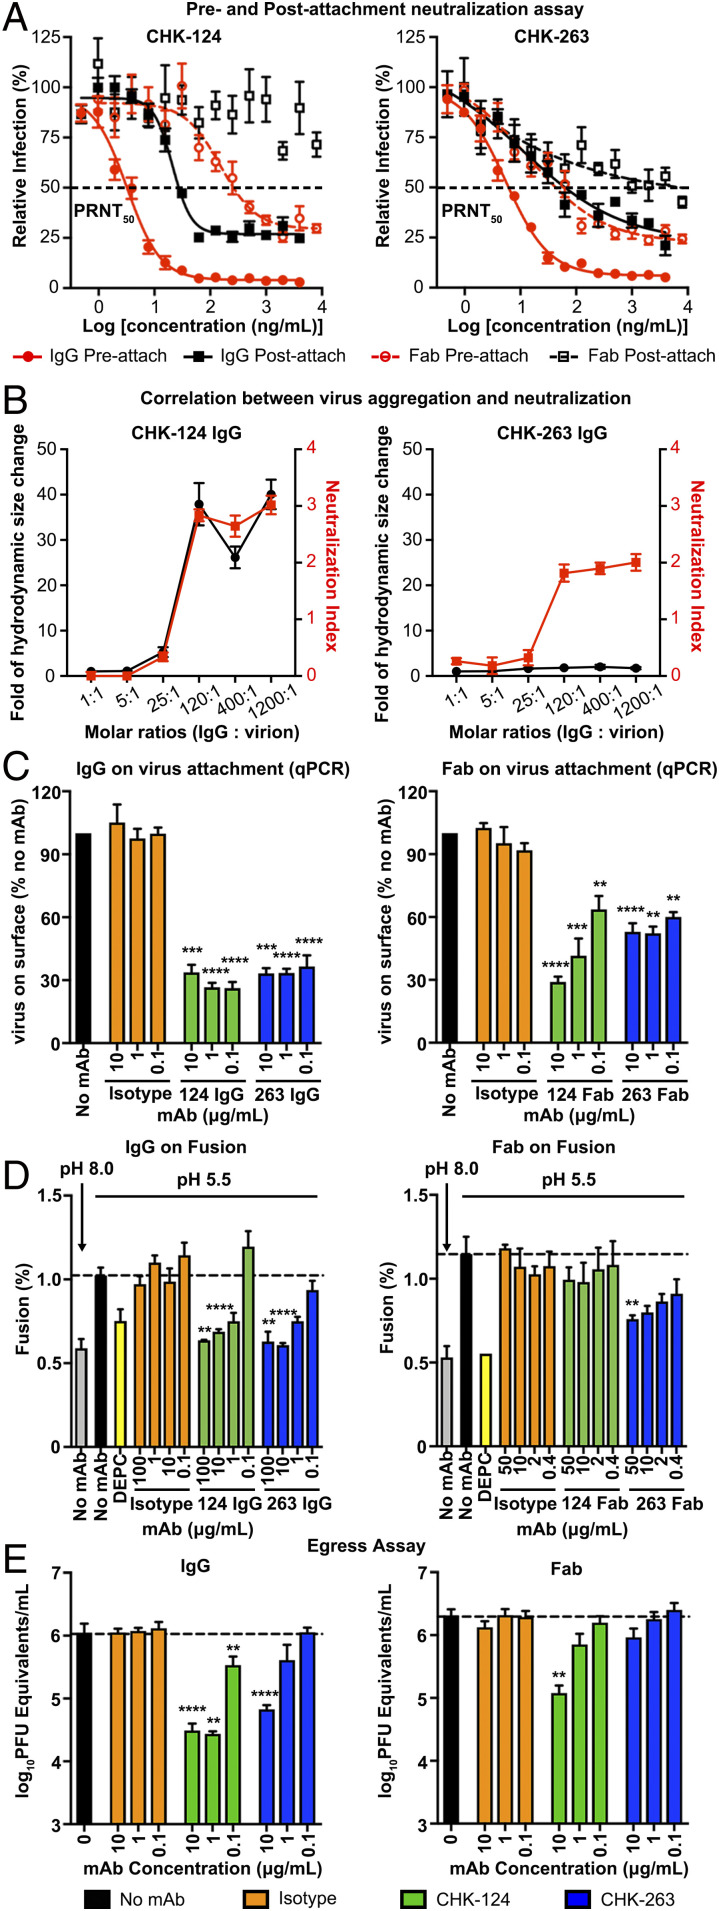
Fig. 2.
CHK-124 and CHK-263 target multiple pathways in the CHIKV infection cycle. In general, CHK-124 inhibitory activities were more dramatically reduced when bivalency of IgG was abolished by the use of Fab fragments compared to CHK-263. (A) CHK-124 and CHK-263 IgGs are highly neutralizing in both pre- and postattachment neutralization assays, whereas their Fabs have weaker activities. PRNT50 values indicating the antibody concentration that neutralized 50% of the plaque-forming units was determined by curve fitting using nonlinear regression in GraphPad Prism v8.0. (B) CHK-124 IgG induced virus aggregation, which correlates with its neutralization profile, whereas CHK-263 does not cause virus aggregation. The hydrodynamic size of CHIKV:CHK-124 IgG and CHIKV:CHK-263 IgG complexes in a different IgG:virion molar ratio was measured by dynamic light scattering (black curve). The neutralization profile of these CHIKV:IgG complexes (red curve) is shown as a neutralization index (right y axis) calculated as the log10 fold reduction of the virus titer compared to the virus-only control. (C) Both CHK-124 and CHK-263 IgG and Fab prevent virus from attaching to cells if antibody:CHIKV complex is formed before addition to cells. Isotype IgG/Fab and no antibody controls were included. (D) Virus:liposomal membrane fusion assays showed that both IgGs of CHK-124 and CHK-263 inhibit virus:liposomal membrane fusion at pH 5.5, similar to the positive control (dethylpyrocarbonate [DEPC]). When Fab fragments were used, the inhibitory effect of CHK-124 was abolished whereas that of CHK-263 Fab was maintained. The extent of fusion was calculated as the percentage of the fluorescence emission before adding Triton X-100 to the full fluorescence emission after adding Triton X-100. (E) CHK-124 has stronger inhibitory activity of viral egress than CHK-263. (A–E) Data are the mean ± SEM from at least three independent experiments. Significance was determined by one-way ANOVA with Dunnett’s posttest compared to isotype control. (**P < 0.01, ***P < 0.001, ****P < 0.0001).

