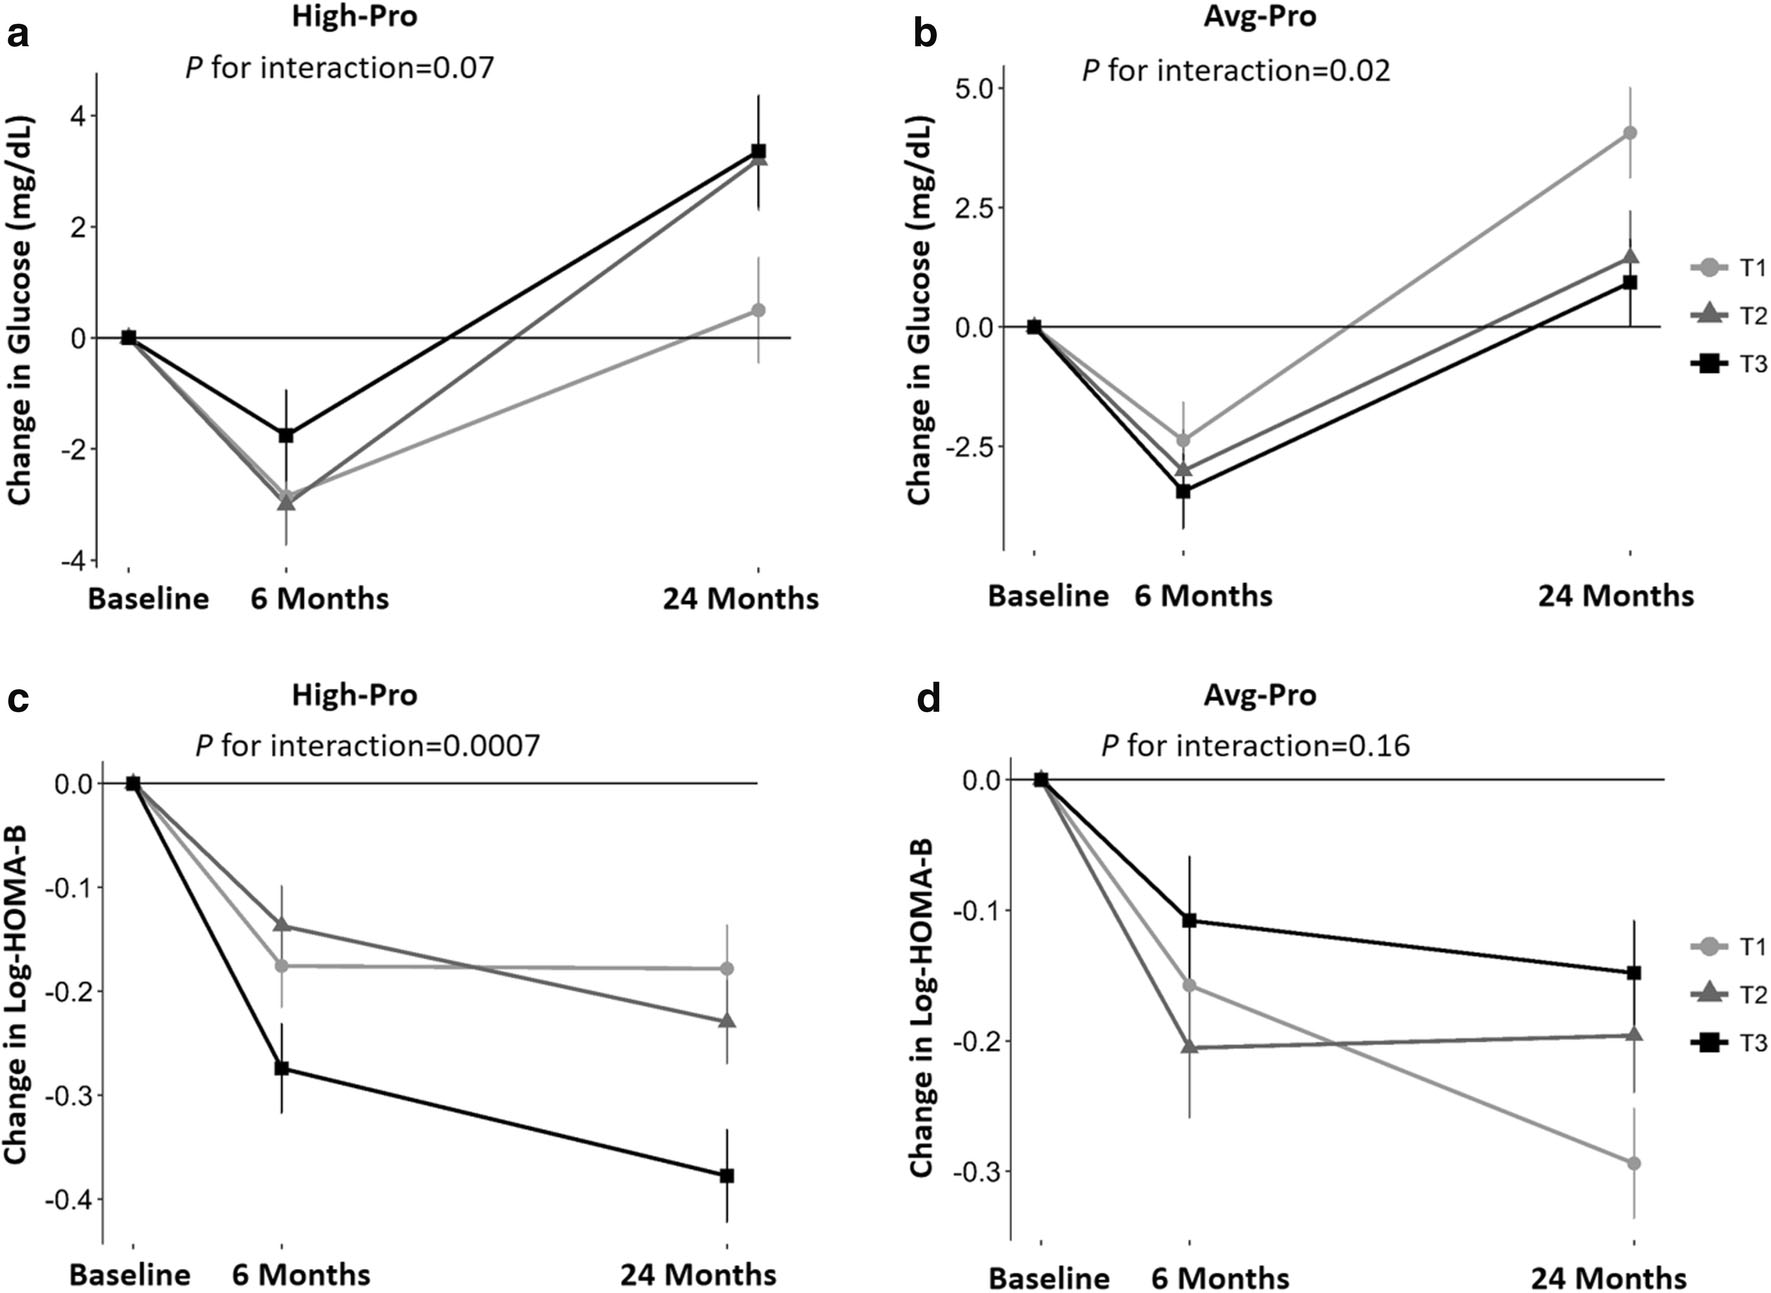
Fig. 2.

WHRonly+ PGS with 2-year trajectory of changes in fasting glucose and HOMA-B in response to weight-loss diet in white participants. Values were means±SEs after adjustment for age, sex, baseline BMI, weight change, and baseline values for respective phenotypes. P values were tested for the interaction between PGS and intervention time. HOMA-B was log-transformed before analysis. HOMA-B, homeostasis model assessment of β cell function; T, tertile. Panel a: changes in glucose in high protein group; panel b: changes in glucose in average protein group; panel c: changes in HOMA-B in high protein group; panel d: changes in HOMA-B in average protein group.
