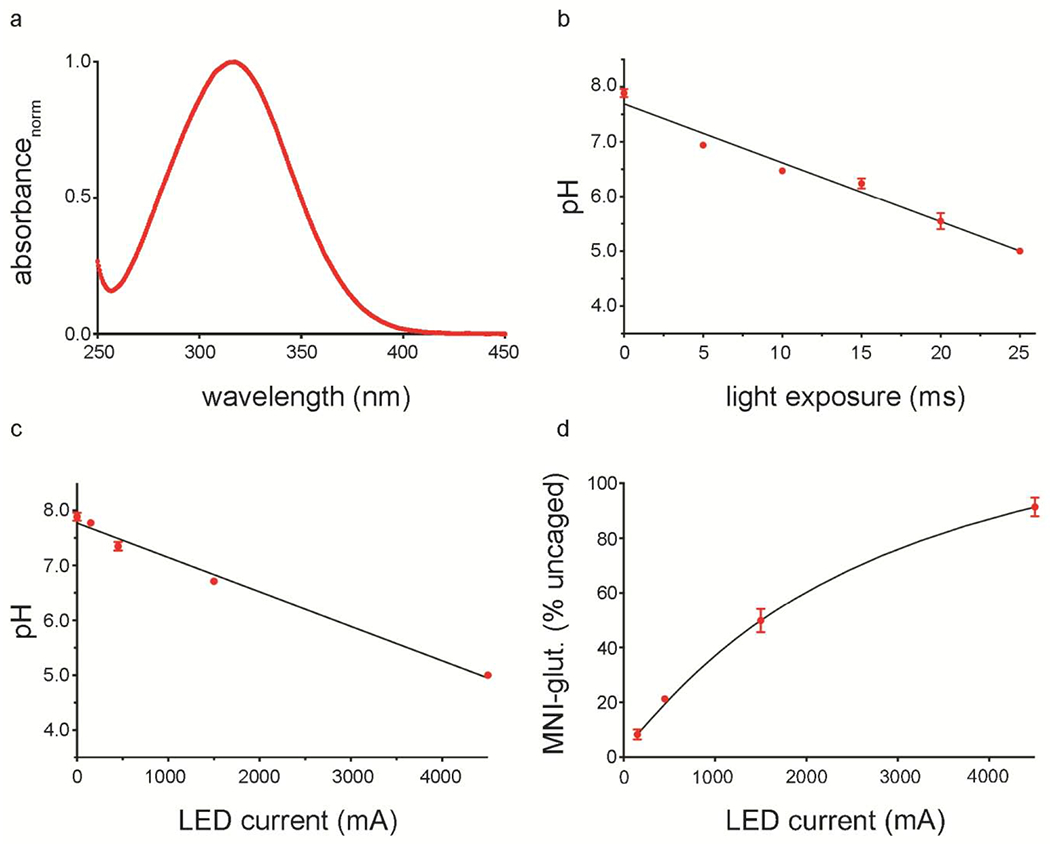
Figure 5. Uncaging protons via light exposure.

a, Absorbance spectrum for MNPS·Na. b-c, Plot of pH vs light exposure time at 4500 mA LED current (b) or pH vs LED current for a 25 ms exposure (c) for MNPS·Na. d, Plot of uncaged glutamate vs LED current for a 25 ms exposure. For b-d, n=3, data represent mean, error bars represent SEM and black lines represent interpolated linear (b-c) and sigmoidal (d) fits.
