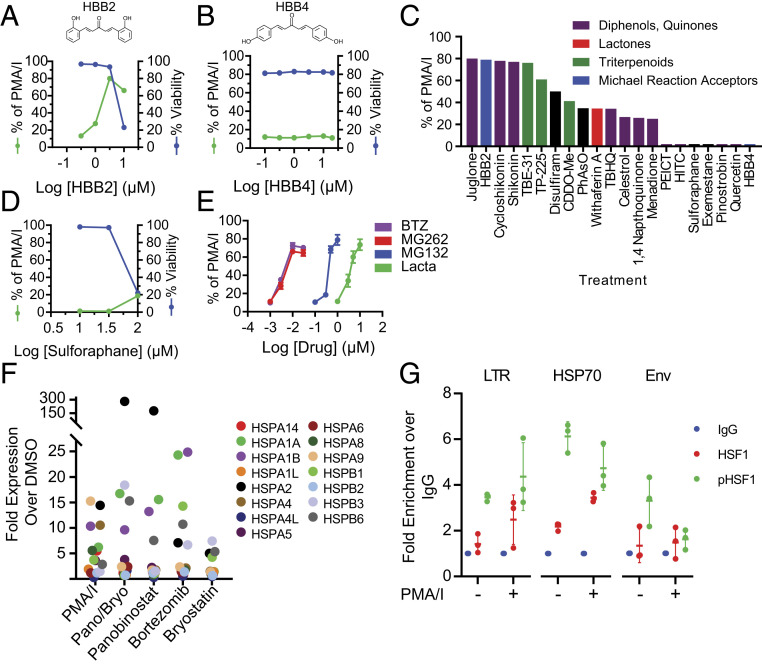
Fig. 1.
A primary cell model of HIV-1 latency (61) is highly responsive to cellular stress. Primary model cells were treated with varying concentrations of HBB2 (A) or HBB4 (B) for 18 h. GFP expression was measured by flow cytometry and expressed as a percentage of the response to the positive control response to the PMA and I, a combination that mimics T cell activation. Viability was measured by 7AAD staining. (C) Compounds known to induce chemical stress (37, 40) were assayed for latency reversal in primary model cells. Model cells were treated with optimal concentrations of the indicated compounds for 18 h before analysis by flow cytometry. Optimal concentrations were predetermined through dose–response analysis with each compound. Colors indicate distinct chemical classes. Results are presented as a percentage of GFP expression observed with PMA/I stimulation. (D) Dose–response curve for reactivation of latent HIV-1 by sulforaphane in primary model cells. Latency reversal and viability were assessed as described in A. (E) Dose responses for reactivation of latent HIV-1 by four proteasome inhibitors in primary model cells. (F) Effect of LRAs on expression of HSP70 gene family members in primary resting CD4+ T cells. Cells were incubated with LRAs for 24 h at concentrations used to reverse latency, and HSP70 family mRNA levels were quantified by RT-qPCR. Results for each individual gene is shown as fold change over the DMSO control. (G) HSF1 and phospho-HSF1 antibodies enrich LTR and HSP70 promoter sequences relative to nontargeted IgG controls in J-Lat cells. Data are shown as fold change over IgG control for each individual experimental replicate.

