. 2021 Mar 4;10:e59612. doi: 10.7554/eLife.59612

Figure 6. Emx1cre/+; Grin2bfl/fl but not Emx1cre/+; Grin2afl/fl mice had the same disrupted callosal innervation patterns as Emx1cre/+; Grin1fl/fl at P14.

Callosal innervation patterns in control Emx1cre/+; Grin2afl/wt (A) and Emx1cre/+; Grin2afl/fl mice (B) at P14. ‘*’ points out M1/S1 border. (C) Quantification of fluorescence density. p=0.392. Callosal innervation patterns in control Emx1cre/+; Grin2bfl/wt (D) and Emx1cre/+; Grin2bfl/fl mice (E) at P14. (F) Quantification of fluorescence density. p=0.03. Scale bar: 500 μm for all images.

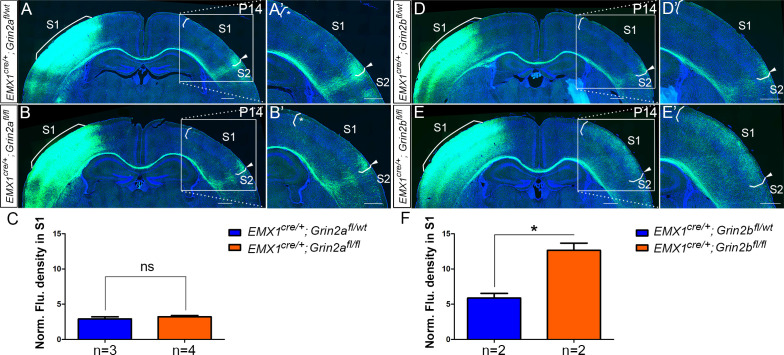
Figure 6.

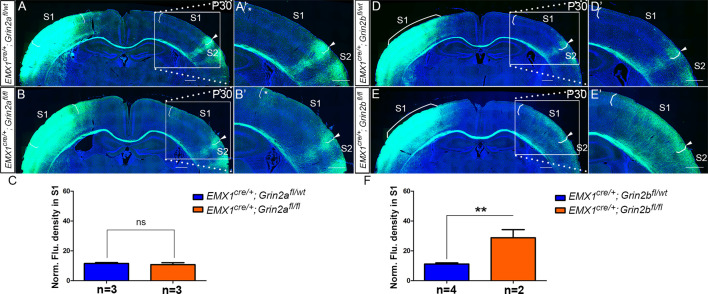
Figure 6—figure supplement 1. NR2B (Emx1cre/+; Grin2bfl/fl) but not NR2A (Emx1cre/+; Grin2afl/fl) mice had same disrupted callosal innervation patterns as Emx1cre/+; Grin1fl/fl at P30.

Figure 6—figure supplement 1.

(A) The callosal innervation pattern in S1 at P30 in control mice (Emx1cre/+; Grin2afl/wt) is similar as the pattern in P14 WT control mice, with few axons in S1 but a dense innervation at S1/S2 border. (B) In the mutant mice (Emx1cre/+; Grin2afl/fl), the general innervation pattern was as same as control. However, the increased callosal innervation at the border of M1 and S1 was persistent at P30 (see ‘*’ in B’). (C) Quantification of fluorescence density. p=0.63. (D) In control Emx1cre/+; Grin2bfl/wt mice, the callosal innervation pattern at P30 was as normal as WT control. (E) However, the increased callosal innervation in Emx1cre/+; Grin2bfl/fl mice lasted at least to P30 as we observed in Emx1cre/+; Grin1fl/fl mice at P30. (F) Quantification of fluorescence density. p=0.007. Scale bar: 500 μm for all images.
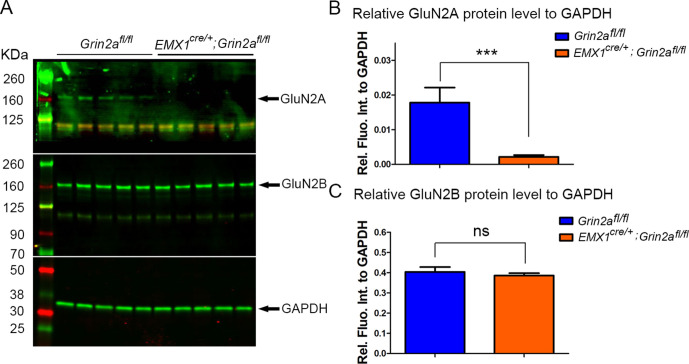
Figure 6—figure supplement 2. The protein expression level of GluN2A and GluN2B in S1 at P8.

Figure 6—figure supplement 2.

(A) Western blot analysis of cortical protein extracts from P8 S1 showed that GluN2A protein has been expressed in S1 at P8. Relative to the loading control GAPDH, the protein levels of GluN2A were greatly reduced in the five samples of Emx1cre/+; Grin2afl/fl mice compared to the five samples of controls. However, the protein levels of GluN2B were same between the five samples of Emx1cre/+; Grin2afl/fl mice and the five samples of controls. (B) Quantification of protein levels of GluN2A relative to GAPDH. p=0.007. (C) Quantification of protein levels of GluN2B relative to GAPDH. p=0.5.