. 2021 Mar 4;10:e59612. doi: 10.7554/eLife.59612

Figure 8. NMDARs cooperate with EPHRIN-B/EPHB in controlling axon targeting in S1.

(A) EPHRIN-B1, expressed by the projecting neuronal axons, signals through EPHB2 and NMDAR, located on the target neurons, regulates axon extension in contralateral cortex. (B, C) Deleting EPHRIN-B1 in projecting neurons in Efnb1fl/fl mice. Vectors expressing Cre and EGFP were delivered into S1 of all pups from Efnb1fl/wt × Efnb1fl/wt crosses by in utero electroporation at E15.5. Compared with control mice (B), ipsilaterally deleted mice showed earlier callosal innervation at P6 (C). (D, E) Blocking NMDAR function in target neurons by intraventricular injection of GluN1Ab in contralateral cortex, from P3 to P6. Compared with control RbIgG injected mice (D), GluN1Ab injected mice showed earlier callosal innervation at P6 (E). (F, G) Blocking EPHB function in target neurons by intraventricular injection of EPHRIN-B1-Fc in contralateral cortex, from P3 to P6. Compared with control Hum Fc injected mice, EPHRIN-B1-Fc injected mice showed earlier callosal innervation at P6 (G). (H, I) Blocking NMDAR and EPHB function simultaneously by GluN1Ab and EPHRIN-B1-Fc in contralateral cortex, from P3 to P6. Compared with control RbIgG + Hum IgG injected mice (H), GluN1Ab + EPHRIN-B1-Fc injected mice showed earlier callosal innervation at P6 (I). (J) Quantification of fluorescence density. Scale bar: 500 μm for all images. Arrows pointed out axon terminals in the target cortex.

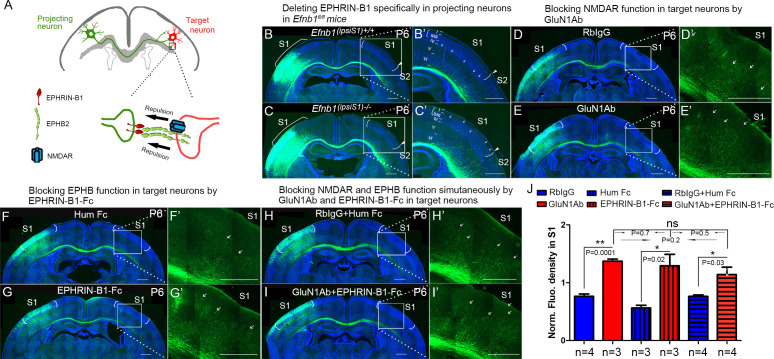
Figure 8.

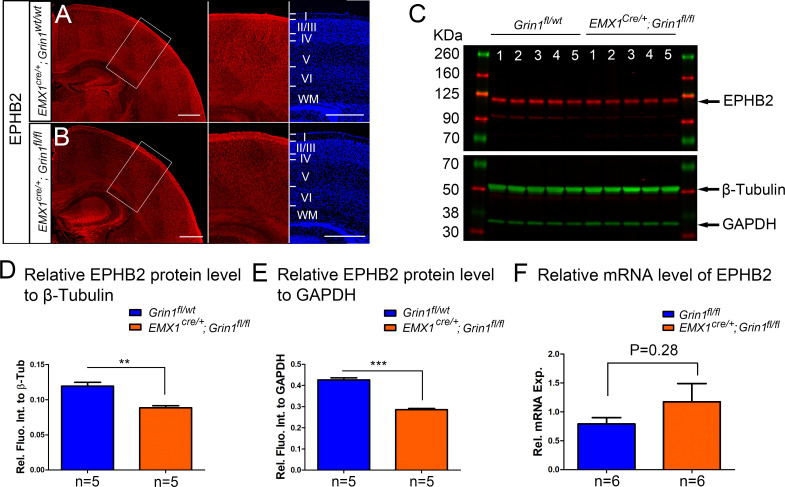
Figure 8—figure supplement 1. The protein but not RNA level of EPHB2 was reduced in Emx1cre/+; Grin1fl/fl mice at P8.

Figure 8—figure supplement 1.

(A, B) EPHB2 protein expression is decreased in Emx1cre/+; Grin1fl/fl mice at P5. In control Emx1cre/+; Grin1wt/wt mice, EPHB2 was expressed both in CC and cortex (A). EPHB2 in Emx1cre/+; Grin1fl/fl mice was decreased in cortex (B). (C) Western blot analysis of cortical protein extracts from P8 S1 showed that, relative to the loading control beta-tubulin (β-Tub) and GAPDH, lower levels of EPHB2 were observed in the five samples of Emx1cre/+; Grin1fl/fl mice compared to the five samples of controls. (D) Quantification of protein levels relative to β-Tub. p=0.001. (E) Quantification of protein levels relative to GAPDH. p<0.0001. (F) The quantitative polymerase chain reaction (qPCR) analysis showed no expression difference of EPHB2 between Emx1cre/+; Grin1fl/fl mice and controls. Scale bar: 500 μm for A, B.
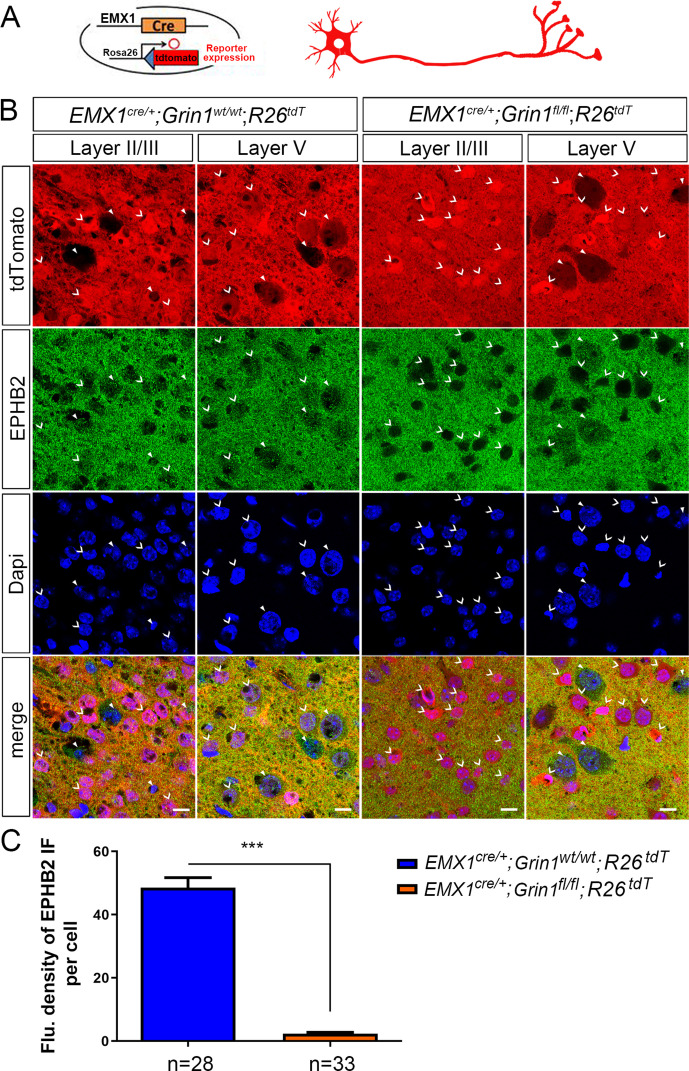
Figure 8—figure supplement 2. The cell membrane expression of EPHB2 was absent in Emx1cre/+; Grin1fl/fl; Rosa26fs-tdTomato positive cells.

Figure 8—figure supplement 2.

(A) We crossed Emx1cre/+; Grin1fl/fl mice with Cre-reporter Rosa26fs-tdTomato mice to produce GluN1 knockout cells labeled with red fluorescence. (B) 12 µm coronal brain sections from P8 Emx1cre/+; Grin1wt/wt; Rosa26fs-tdTomato and Emx1cre/+; Grin1fl/fl; Rosa26fs-tdTomato mice of the same litter. Immunostaining of EPHB2 was done in all brain sections. Broad arrowheads pointed the cells with Cre recombination. Triangle arrowheads pointed to cells with Cre recombination. V shaped arrowheads pointed to cells without Cre recombination. In control Emx1cre/+; Grin1wt/wt; Rosa26fs-tdTomato mice, EPHB2 signals were detected on both Cre recombination and non-Cre recombination cells. However, in Emx1cre/+; Grin1fl/fl; Rosa26fs-tdTomato mice, EPHB2 signals were only detected on non-Cre recombination cells, but absent on Cre recombination cells with deletion of GluN1. (C) Quantification of fluorescence density of EPHB2 immunostaining for each cell. Compared to control (Emx1cre/+; Grin1wt/wt; Rosa26fs-tdTomato mice), the protein expression of EPHB2 in Cre recombination cells in Emx1cre/+; Grin1fl/fl; Rosa26fs-tdTomato mice was dramatically decreased. p<0.0001. Scale bar: 10 μm for all images in B. R26tdT: Rosa26fs-tdTomato.