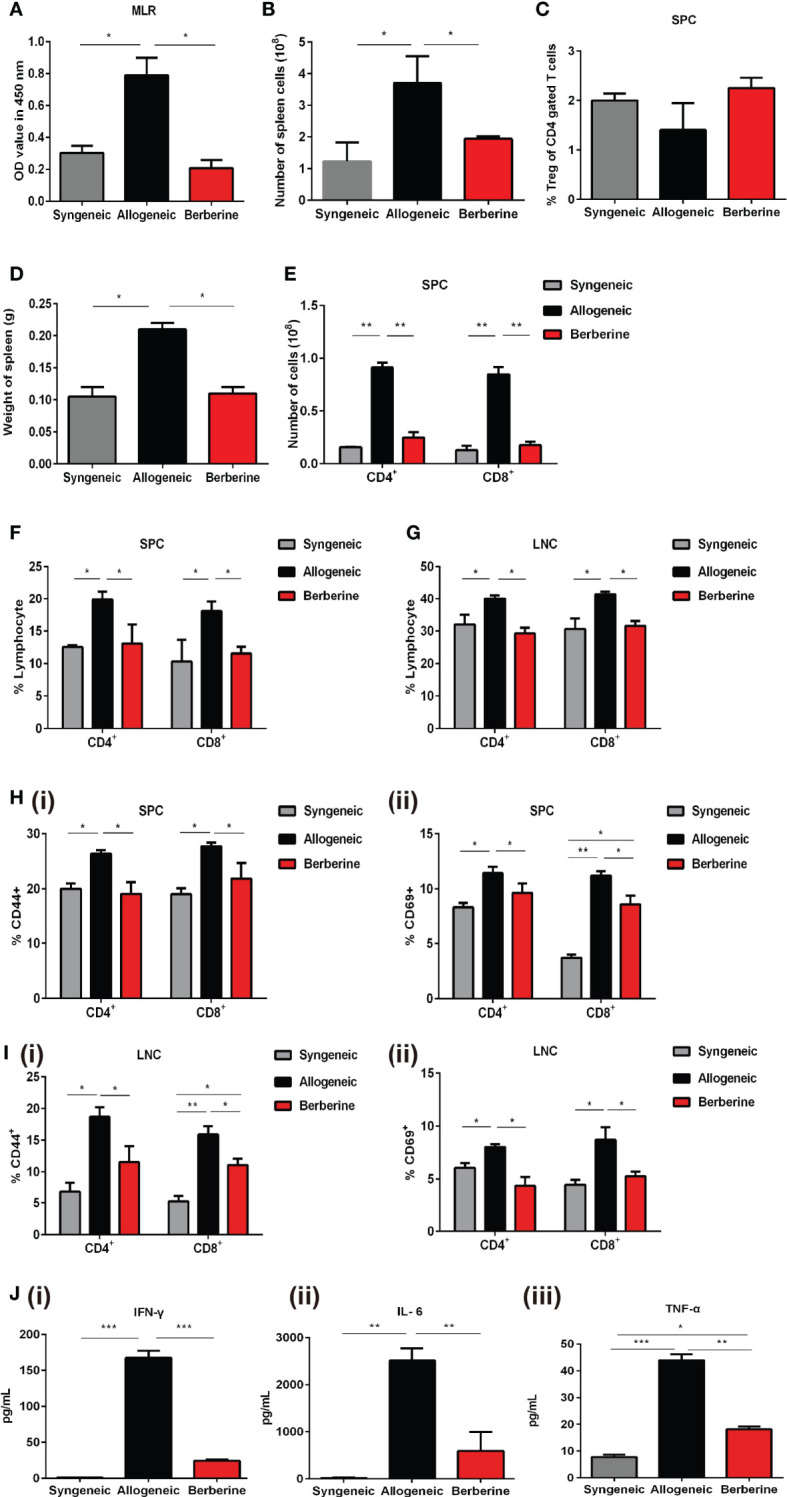
Figure 3.

Effect of berberine treatment on the T cell immune responses to cardiac allografts. (A) MLR responses. Recipient SPCs were isolated at POD 7 (responders) and mitomycin C-treated naïve BALB/c SPCs (stimulators) were co-cultured for 3 days (n = 3 mice/group). Total SPCs were isolated at PDO 7, and the absolute numbers of (B) SPCs were determined by flow cytometry. (C) The percentage of CD4+Foxp3+Treg cells was determined by flow cytometry. Syngeneic recipients are shown for comparison (n = 3 mice/group). (D) The spleens of recipient mice were harvested and weighed at POD 7 (n = 5 mice/group). (E) The absolute numbers of CD4+ and CD8+ T cells SPCs (n = 3 mice/group). (F) SPCs and (G) LNCs were isolated at POD 7, and the percentage of CD4+ and CD8+ T cells was determined by flow cytometry. Syngeneic recipients are shown for comparison (n = 3 mice/group). (H) CD44+CD69+ T cell activation assays. SPCs were isolated at POD 7, and the percentages of (i) CD4+CD44+CD69+ and (ii) CD8+CD44+CD69+ T cells were determined by flow cytometry (n = 3 mice/group). (I) LNCs were isolated at POD 7, and the percentages of (i) CD4+CD44+CD69+ and (ii) CD8+CD44+CD69+T cells were determined by flow cytometry (n = 3 mice/group). (J) Serum plasma levels of proinflammatory cytokines. Peripheral blood was collected at POD 7, and (i) IFN-γ, (ii) IL-6, and (iii) TNF-α plasma levels were measured by ELISA (n = 3 mice/group). SPCs, spleen cells; LNCs, lymph node cells; MLR, mixed lymphocyte reaction; POD, post-operative day. *p < 0.05, **p < 0.01, ***p < 0.001 compared to the normal saline-treated group.
