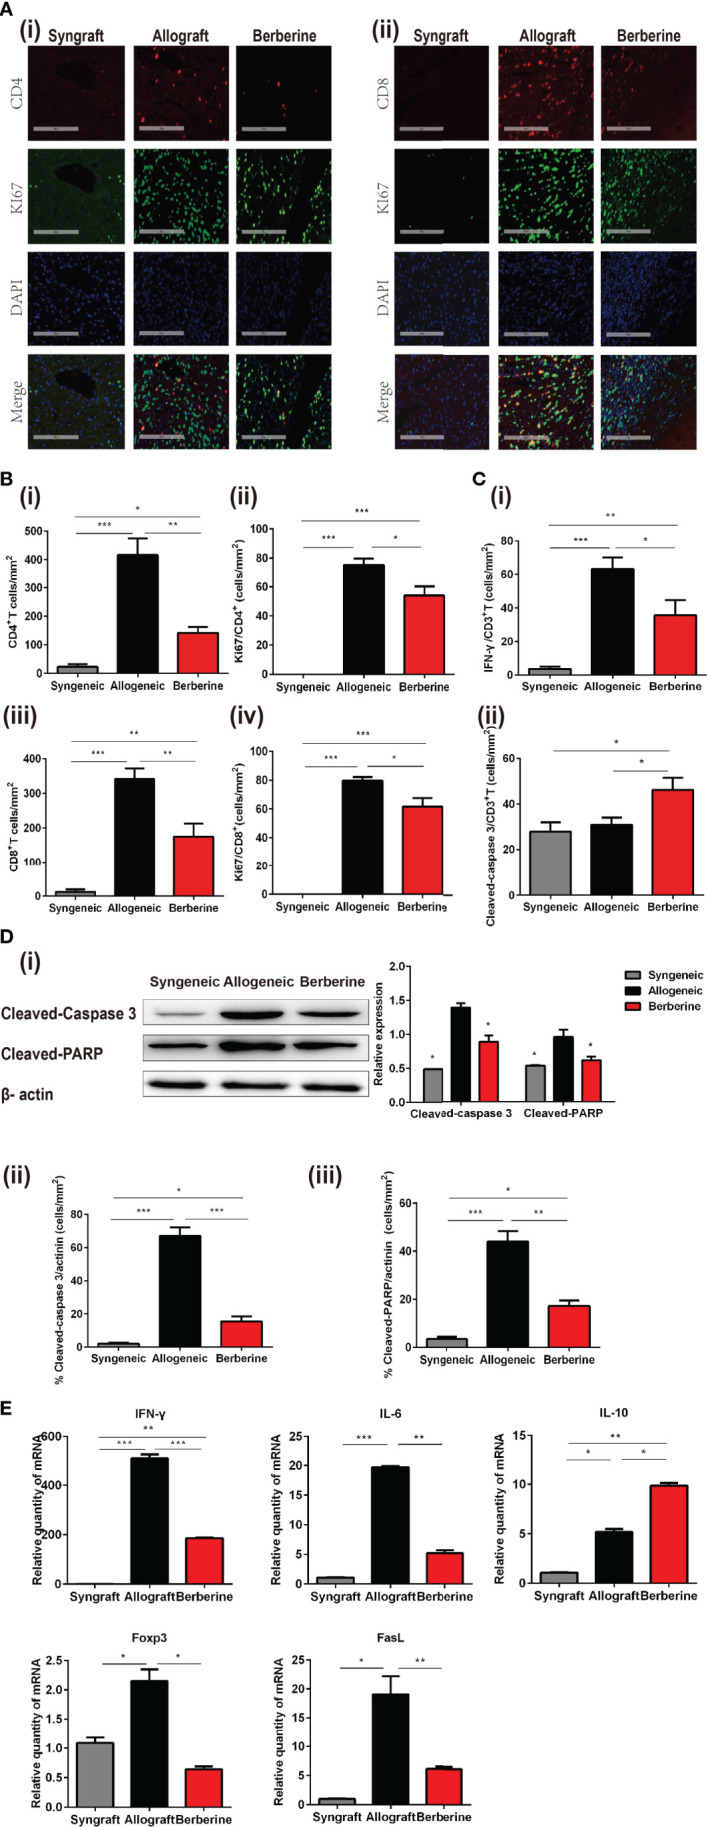
Figure 4.

Phenotypic and functional characteristics of allograft-infiltrating CD4+ or CD8+ T cells. Allografts were recovered at POD 7, and POD 100 syngeneic grafts are shown for comparison. (A) (i) Immunofluorescent staining of CD4 (red), KI67 (green), and 4′,6-diamidino-2-phenylindole (DAPI, blue) in grafts. (ii) Immunofluorescent staining of CD8 (red), KI67 (green), and DAPI in grafts (Scale bar = 200 μm; original magnification: ×200). (B) Proportion and absolute number of graft-infiltrating (i) CD4+ T cells and their expression of (ii) KI67, and proportion and absolute number of graft-infiltrating (iii) CD8+ T cells and their expression of (iv) KI67 (n = 3 mice/group). (C) Proportion of (i) IFN-γ and (ii) cleaved-caspase-3 in graft-infiltrating CD3+ T cells (n = 3 mice/group). (D) (i) Cleaved-caspase-3 and cleaved-PARP protein expression in grafts. Myocardial cell apoptosis co-immunofluorescence staining and expression of (ii) cleaved-caspase-3 and (iii) cleaved-PARP (n = 3 mice/group). (E) Relative mRNA expression of IFN-γ, IL-6, IL-10, Foxp3, and FasL in grafts measured by qPCR (n = 3 mice/group). SPCs, spleen cells; LNCs, lymph node cells; POD, post-operative day. *p < 0.05, **p < 0.01, ***p < 0.001 compared to the normal saline-treated group.
