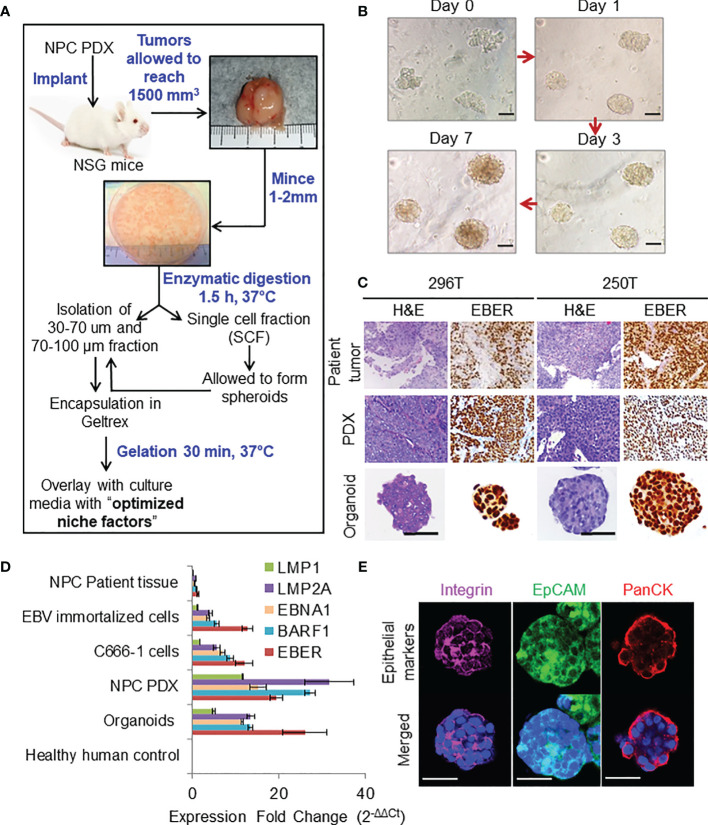
Figure 1.
Organoid establishment and characterization. (A) Schematic of organoid culture and establishment. (B) Organoid growth pattern and morphology; magnification 200×, scale bar 100 µm. (C) Representative images of H&E staining and corresponding EBER RNA ISH of 296T and 250T patient tumors and corresponding PDXs as well as organoids; magnification 400×, scale bar 100 µm. (D) Expression of latent EBV genes in different NPC samples quantified by qPCR, fold changes are relative to healthy human control samples and normalized by changes in beta-actin values, n = 3. (E) Representative confocal microscopy images of organoids following immunofluorescent staining with anti-integrin (magenta), anti-EpCAM (green), and anti-Pan cytokeratin (PanCK) (red) antibodies. Lower panel is the merged image with nuclear staining using Hoechst 33342 (blue); magnification 600×, scale bar 100 µm.

