Figure 2.
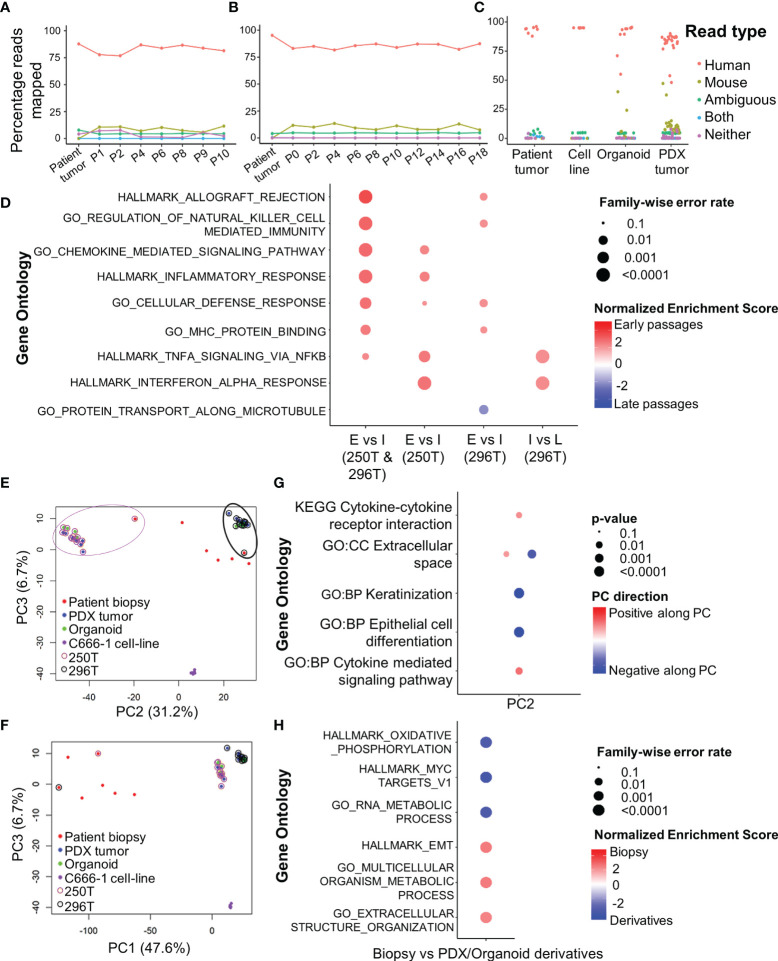
RNA-seq analysis of primary human tumors, and corresponding PDX and organoid models. Xenome output mapping of (A) 250T patient tumor and corresponding PDX tissue at different passages ranging from P0-P10, (B) 296T patient tumor and corresponding PDX tissue at different passages ranging from P1-P18, and (C) different samples including patient tumor biopsies, C666-1 cell line (monolayer and spheroids), PDXs, and organoids. (D) Top gene ontologies based on gene expressions between the different passages of the PDX. E, Early passages (≤P2); I, intermediate passages (P3-P10); and L, late passages (>P10, only applicable to 296T). (E, F) PCA showing the clustering of primary tumors (biopsies), PDXs, organoids, and c666-1 cell line samples. PC1 corresponds to heterogeneity between the primary tumors, PDXs, as well as organoids; PC2 corresponds to the inter-tumoral differences; PC3 corresponds to the differences between C666-1 cell-lines and primary tumors and its derivatives (PDX and organoids). (G) Top different gene ontologies inferred from the top genes contributing to PC2. (H) Top different gene ontologies based on gene expressions between the original tumor and PDX/organoids.

