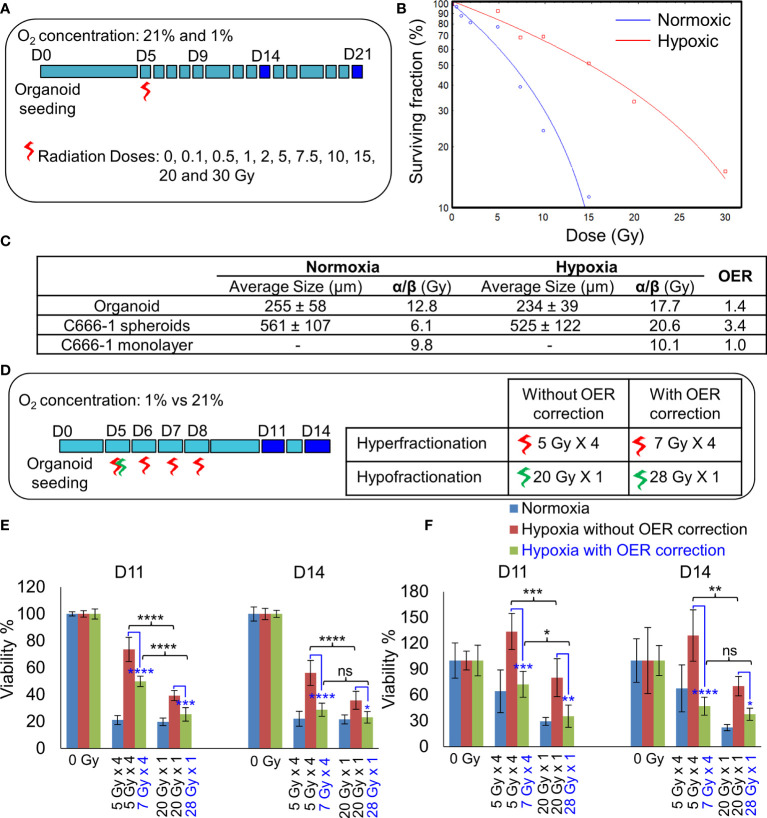
Figure 4.
Establishment of radiobiological parameters of NPC. (A) Schematic of RT regimen for establishment of α/β ratio, dark blue box represents days on which data was used to plot the LQ curve. (B) Representative radiation dose-survival (LQ) curves of organoids in normoxic and hypoxic conditions at D21. (C) Tabulated summary of the average size of the organoids/spheroids at Day 14, experimentally calculated α/β ratio of various NPC models and their OER values. (D) Schematic of in-vitro RT regimen to validate experimentally established OER. Viability of 296T (E) and 250T organoids (F) following single bolus and fractionated RT regimen without and with OER correction, n = 5. ns, not significant, *p = 0.05, **p = 0.005, ***p < 0.001, ****p < 0.0001. OER, oxygen enhancement ratio.

