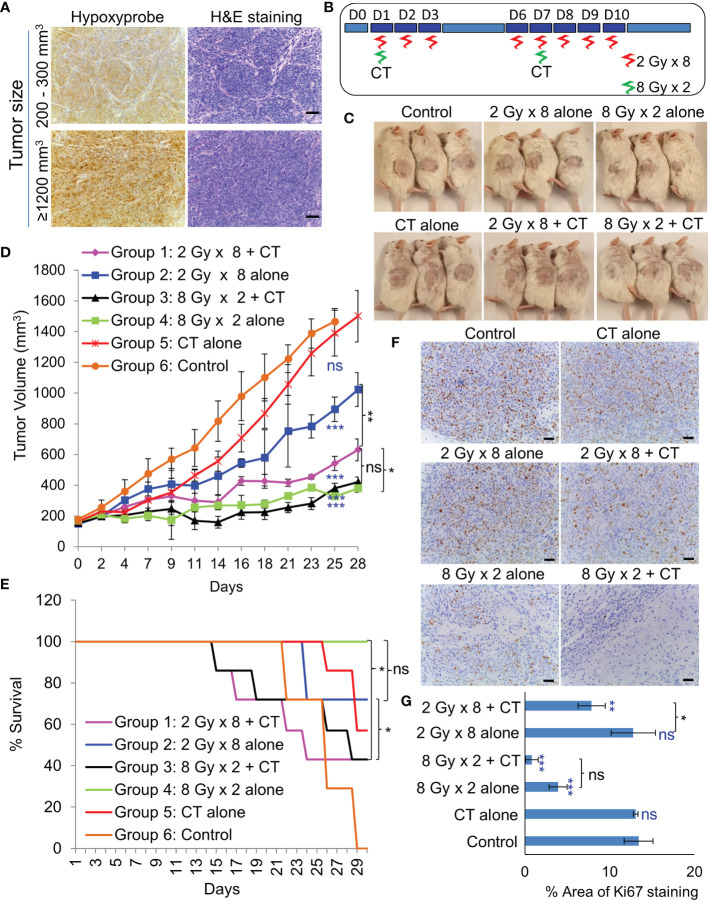
Figure 5.
Effect of in-vivo RT. (A) Representative images of immunohistochemical staining of hypoxic regions using Hypoxyprobe and corresponding H&E staining of tumor tissue; magnification 200×, scale bar 200 µm. (B) Schematic of RT regimen with and without CT. (C) Representative images of mice showing the size of PDX (296T) tumors at Day 20 from the start of the treatment. (D) Tumor growth volume measurements from day 0 to 28, n = 7, ns, not significant, *p = 0.0065, **p = 0.0001, ***p < 0.0001. Blue asterisk denotes p values of treatment group vs. untreated control at day 25. (E) Survival curve following the treatment of the animals up to day 30, n = 7. Statistical analysis was performed using the log-rank test, *p < 0.05. (F) Representative images of immunohistochemical staining of Ki67 in the harvested tumor tissue following different treatment, magnification 200×, scale bar 250 µm. (G) Percent area of Ki-67 positive nuclear staining in harvested tumor tissues, n = 3, *p < 0.05, **p < 0.01, ***p < 0.0001. Blue asterisk denotes p values of treatment group vs. untreated control.

