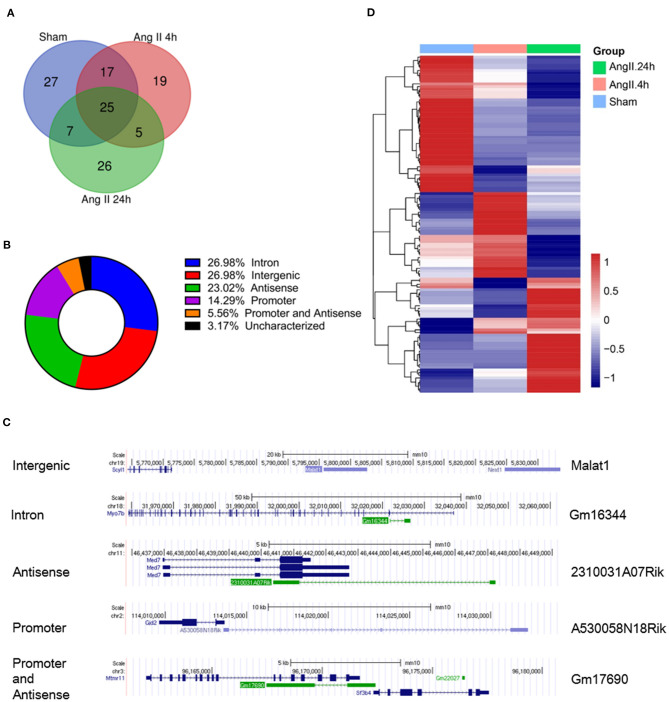
Figure 2.
Profiles of EZH2-binding ncRNAs in mouse hearts treated with AngII at different time points. (A) Venn diagram showing the number of overlapped ncRNAs from three groups as indicated. (B) Pie chart showing the distribution of ncRNA categories according to their genomic features. (C) Representative ncRNA for each category. (D) Heat map showing hierarchical clustering of changed EZH2-associated ncRNAs after AngII treatment at different time points. Up-regulated and down-regulated genes are colored in blue and yellow, respectively.

