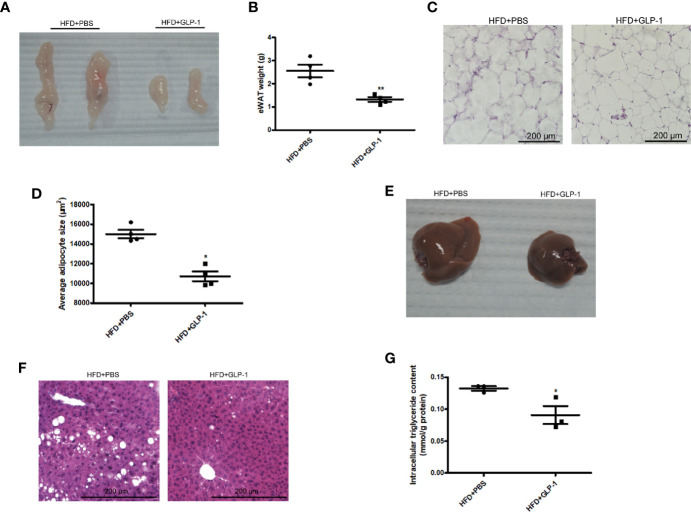
Figure 2.
Effects of M-GLP-1 on adipose tissue weight and hepatic lipid accumulation in mice fed with HFD. (A) The images of epididymal adipose tissue from PBS and GLP-1 treated mice. (B) The weights of epididymal adipose tissue from the two groups of mice. (C) The morphological analysis of Hematoxylin and eosin staining in epididymal adipose tissue from the mice. (D) The measurement of adipocyte cross-sectional surface area from the two group mice under HFD. (E) The image of liver tissue from the two groups of mice. (F) The morphological analysis of Hematoxylin and eosin staining in liver tissue from the mice. (G) The intracellular TG levels in two groups of mice under HFD. The values represent the means ± SD, *p < 0.05 and **p < 0.01, n = 5 per group.

