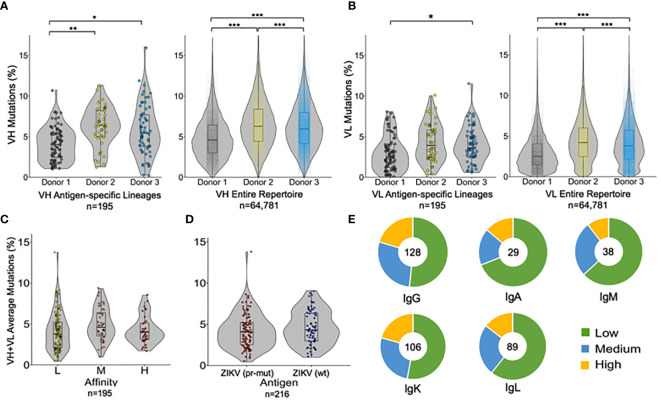
Figure 5.
Paired genetic and functional analysis of antibody repertoire data. Percentage of somatic hypermutations in (A) heavy chain variable regions and (B) light chain variable regions, shown for each donor in both antigen-specific cells (left), and the entire repertoire (right). Each point represents a single heavy or light chain antibody lineage sequence. (C, D) Average SHM percentage of both VH and VL genes in the antigen-specific repertoire are reported based on (C) antibody affinity, or (D) antigen targets. (E) Isotype analysis for antibody lineages after separating into low-, medium-, and high-affinity groups. The total number of antibody lineages for each isotype are indicated in the center of the chart. Circles on SHM graphs represent individual points; box-and-whisker plots indicate median ± quartiles. Pairwise comparisons were performed using the K-S test and all statistically significant comparisons are noted (***p < 10−6, **p < 10−3, *p < 0.0167); any non-statistically significant comparisons are omitted.

