Figure 7.

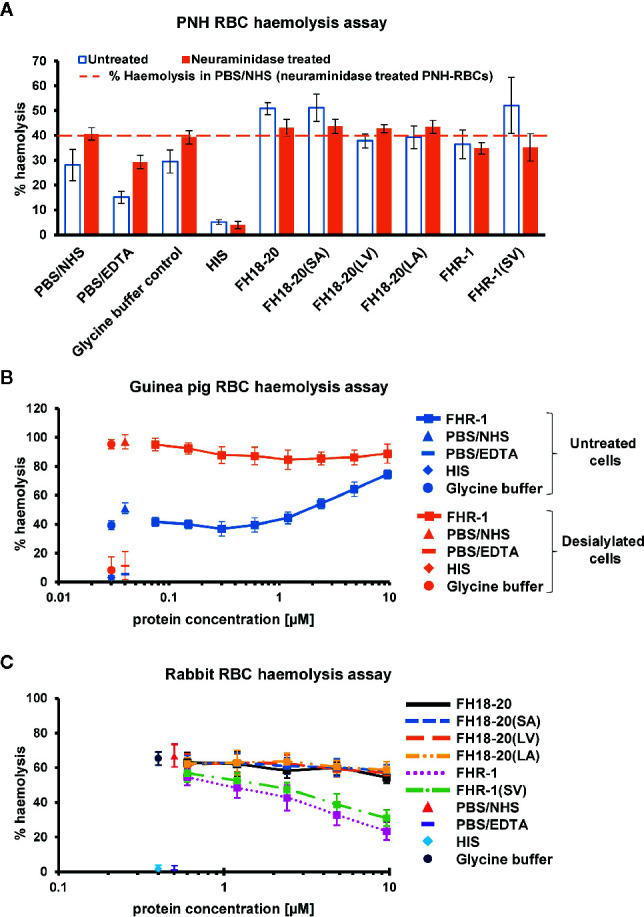
Functional cell assays on foreign and foreign-like surfaces. (A) Hemolysis assay of untreated and neuraminidase-treated PNH erythrocytes. Desialylated PNH erythrocytes were treated with neuraminidase before exposing them to serum. PNH erythrocytes were incubated with NHS in presence of 9.6 µM of the different FH18-20 and FHR-1 analytes. Lysis and subsequent release of hemoglobin was determined by UV absorbance at 405 nm. All values were normalized to lysis in water (100% lysis mark). The mean percentage of hemolysis of three independent assays, each conducted in duplicate, is shown (with SD) for untreated (white with blue border) and neuraminidase-treated (orange) PNH erythrocytes. As controls, NHS and HIS were used, each mixed with PBS. As a further control NHS was mixed with the highest concentration of glycine buffer used in the sample containing 9.6 µM of FHR-1(SV). A fourth control was added, which consisted of NHS mixed with PBS containing 5 mM EDTA. The dashed line indicates the hemolysis level in PBS/NHS for neuraminidase-treated PNH erythrocytes as reference. (B) Hemolysis assay of untreated and neuraminidase-treated guinea pig erythrocytes. Same assay as in (A), but only a concentration series (9.6–0.1 µM) of FHR-1 as analyte. (C) Rabbit erythrocytes hemolysis assay. Rabbit erythrocytes were incubated with NHS in the presence of increasing amounts (0.3–9.6 µM) of the different FH18-20 and FHR-1 analytes. Lysis was determined as described for the neuraminidase-treated PNH erythrocytes hemolysis assay. The mean percentage of hemolysis of three independent assays, each conducted in duplicate, is shown with SD and plotted against the protein concentration in µM. The same controls were used as described for the neuraminidase-treated PNH erythrocytes hemolysis assay.
