Figure 8.

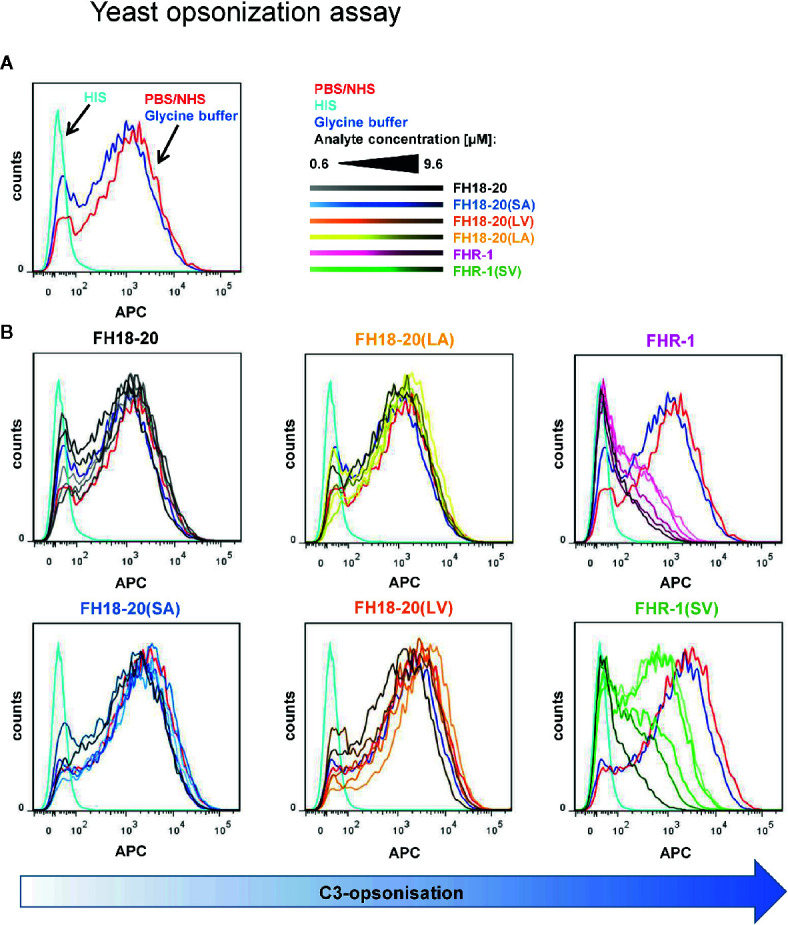
Yeast opsonization assay. Flow cytometric analysis of Pichia pastoris KM71H yeast cells after exposure to serum mixed with increasing amounts (0.6–9.6 µM) of the different FH18-20 and FHR-1 analytes. Cells were labeled with anti-C3d antibody and a secondary detection molecule with APC fluorescence marker to measure levels of C3-opsonization. As controls, NHS (red) and HIS (cyan), each mixed with PBS as analyte, and NHS mixed with the highest concentration of glycine buffer used in the sample containing 9.6 µM of FHR-1(SV) were used. (A) The controls without protein analytes are shown. (B) The histograms of each analyte series are shown. In each series the increasing concentration of the analyte is indicated by a corresponding color gradient. One representative of two independent experiments is shown (the second experiment is reported in the Supplementary Figure 6 ). FlowJo (version 7.6.5) was used as evaluation tool.
