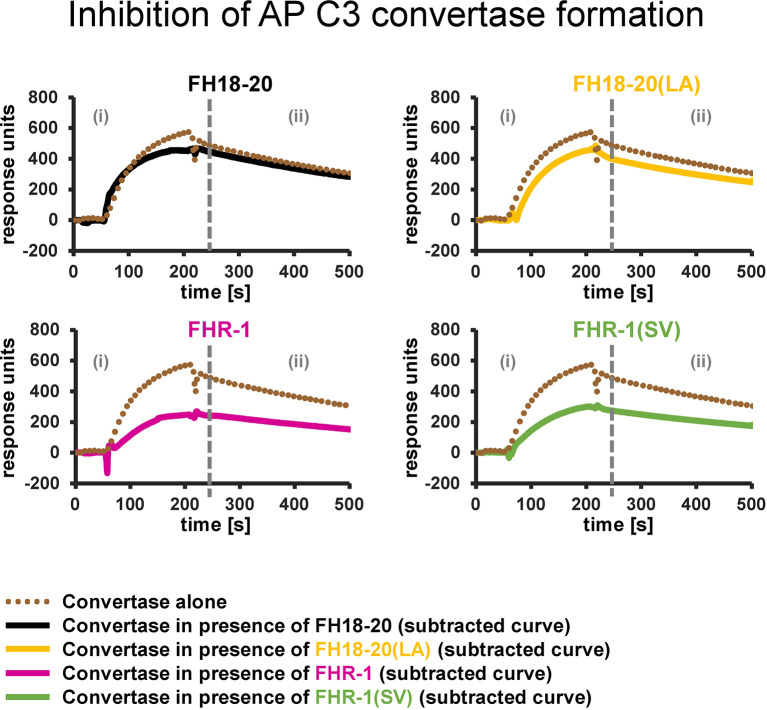
Figure 9.
Inhibition of AP C3 convertase formation. Effect of FH18-20, FHR-1 and their double mutants on AP C3 convertase formation. In each panel two different sensorgrams are shown: the signal of the AP C3 convertase alone, obtained by injection of FB (600 nM) and FD (100 nM) over a CMD500M sensor chip with 6,000 RUs of amine-coupled C3b immobilized, is shown as a dotted brown line. The curves obtained subtracting the signal of the analyte alone (injected at a concentration 10 times higher than the measured KD value) from that of the analyte/convertase mix (subtracted curves) are shown in solid black, yellow, pink, and green for FH18-20, FH18-20(LA), FHR-1, or FHR-1(SV), respectively. All shown sensorgrams are reference-subtracted. All sensorgrams, including the subtracted curves and their overlay, are reported in the Supplementary Figure 7 .

