FIGURE 4.
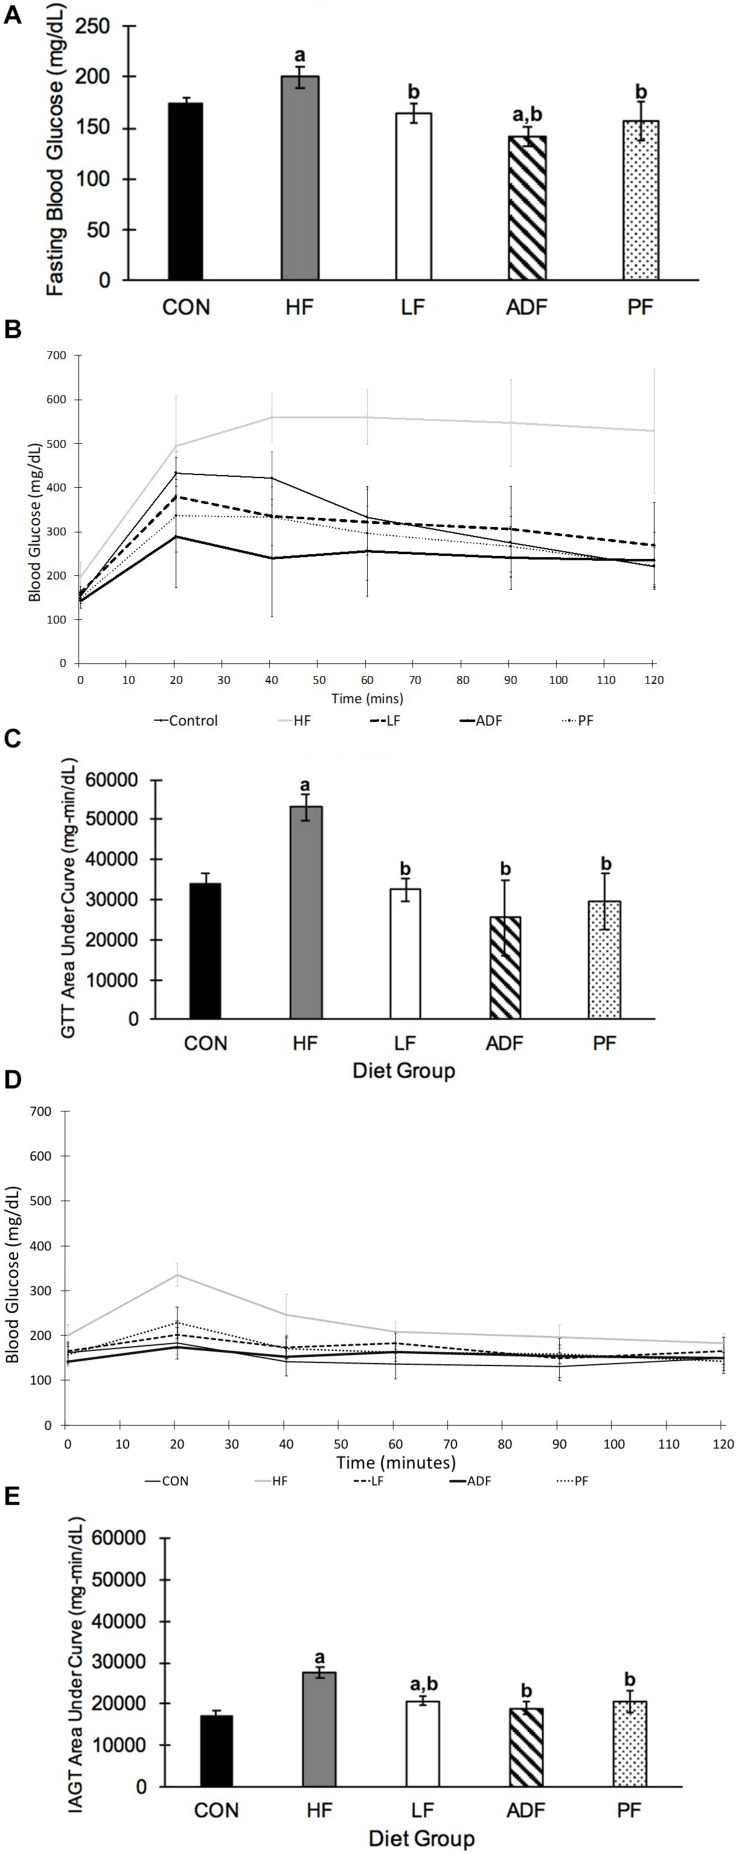
Blood glucose and glucose tolerance tests. (A) Fasting blood glucose. Blood glucose was measured after a 6 h fast, which started at the onset of the light phase. Blood glucose of ADF mice was measured after a fed day. Mice in the HF group had significantly higher fasting blood glucose than all other diet regimens (p < 0.05). ADF mice had significantly lower blood glucose compared to CON mice (B) Glucose tolerance test. A GTT was conducted after a 6 h fast, which began at the onset of the light phase. ADF mice were tested after a fed day. Samples were collected 20, 40, 60, 90, and 120 min after intraperitoneal injection of glucose. (C) Glucose tolerance test area under the curve (AUC). The “area under the curve” calculation was measured using the lowest blood glucose concentration from the GTT as a baseline. All mice were significantly more glucose tolerant than HF mice. (D) Insulin assisted glucose tolerance test. An IAGT was conducted after a 6 h fast, which began at the onset of the light phase. ADF mice were tested after a fed day. Mice were 23 weeks of age and 9 weeks into their experimental diets at the time of the IAGT. Mice were given intraperitoneal injections of a cocktail of 1 g glucose/kg body weight with 0.75 U/kg body weight in 0.1–0.2 cc of sterile saline. (E) Insulin assisted glucose tolerance test area under the curve (AUC). HF mice had a significantly larger AUC than all other diet regimens, once again suggesting that they are more glucose intolerant than the other diet regimens. a: p < 0.05 vs. CON; b: p < 0.05 vs. HF.

