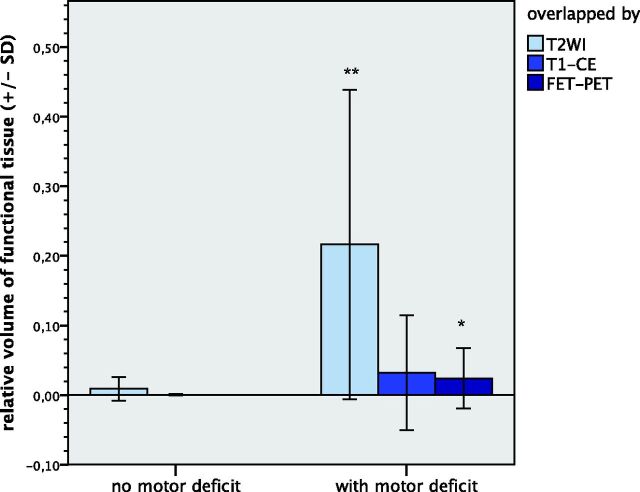
Fig 3.
The overlapping volume of the motor functional tissue with the T2WI lesion and with the FET-PET lesion, respectively, is significantly greater in the motor-impaired group than the preserved group. Double asterisks indicate P < .01; asterisk, P < .05. The difference of the overlap volume between functional tissue and T1-CE tumor extent in the patients with motor weakness compared with the preserved patients is limited to a statistical trend (P = .09).

