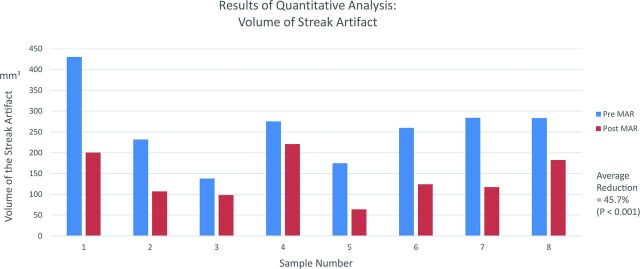
Fig 5.
Quantitative analysis of streak artifacts. A graph compares the volume of streak artifacts of the pre- and post-MAR images. In all 8 samples, the volume of streak artifacts in the pre-MAR images is significantly reduced in the post-MAR images. The average artifacts reduction for all samples is 45.7% (P = .001).

