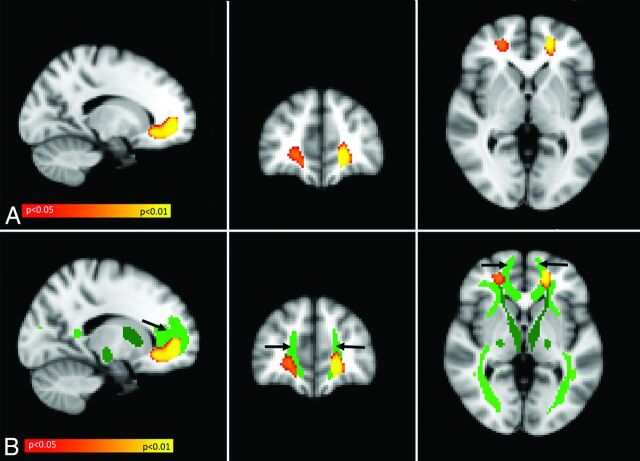
Fig 1.
Result of voxel-based MTR symptom-mapping analysis. A, Yellow/orange represents MTR voxels positively related to gait velocity. The statistical map is superimposed on the MNI-152 standard space template and is family-wise error–corrected for multiple comparisons (P < .05). The result is independent of age, sex, height, the presence of microbleeds, SPPB total score, diabetes, hyperuricemia, and brain volume. B, The statistical map shown in A (MTR voxels positively related to gait velocity) is now superimposed on the Johns Hopkins University DTI-based white matter tract atlas. Shades of green indicate different white matter tracts, as defined by the atlas. Most of the MTR voxels positively related to gait velocity (yellow/orange) are located within the forceps minor (light green frontal tract, indicated by black arrows).

