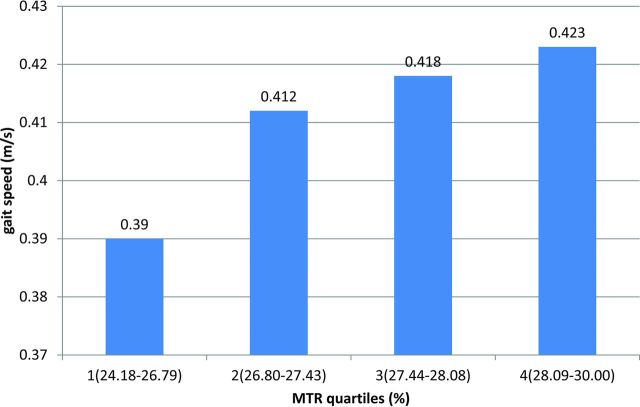
Fig 3.
Analysis of covariance results. The mean MTR (percentage) of the forceps minor was divided into quartiles (x-axis). The first quartile was the lowest. Ranges of the MTR quartiles are as follows: quartile 1, 24.18–26.79; quartile 2, 26.80–27.43; quartile 3, 27.44–28.08; quartile 4, 28.09–30.00. Values on the y-axis represent the estimated mean walking speed in meters/second of subjects within each quartile, adjusted for age, sex, height, SPPB total score, the presence of microbleeds, diabetes, hyperuricemia, and brain volume. Increasing MTR values within the forceps minor are related to higher gait velocity in a dose-dependent manner (P for linear trend = .031).

