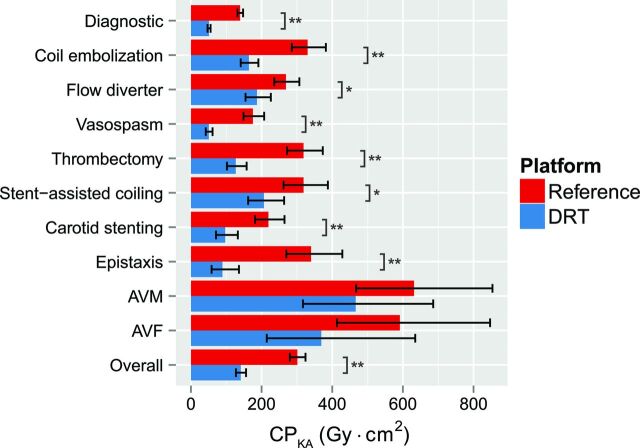
Fig 1.
The cumulative dose-area product is significantly reduced with the dose-reduction technology platform. Bar graph and error bars represent least squares means and the associated 95% confidence intervals. Note a significant reduction in CPKA between the dose-reduction technology and reference platforms. Asterisk indicates P < .05; double asterisks, P < .0001.

