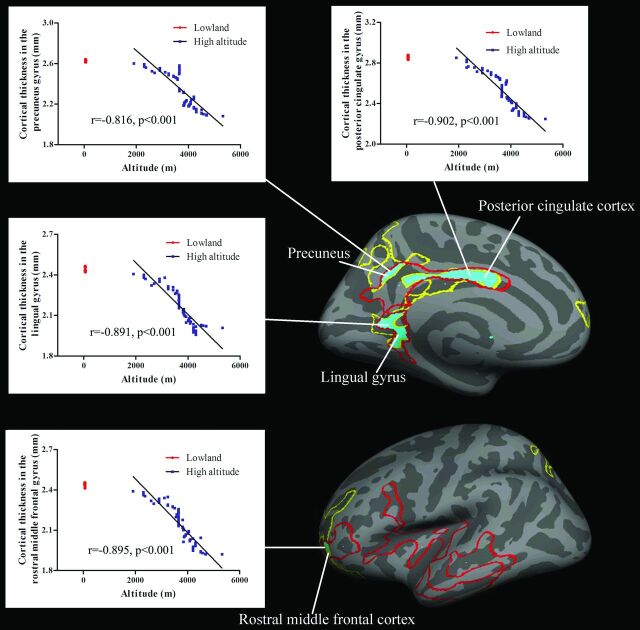
Fig 3.
Tibetan brain overlaps (blue areas) between the regions showing significant decreases of cortical thickness (yellow line) and those showing correlations between cortical thickness and altitude (red line). For each correlation diagram, 80 overlapped red dots indicate the cortical thickness values in the sea-level controls. Blue dots indicate that the cortical thickness values in 77 Tibetans were significantly correlated with altitude.

