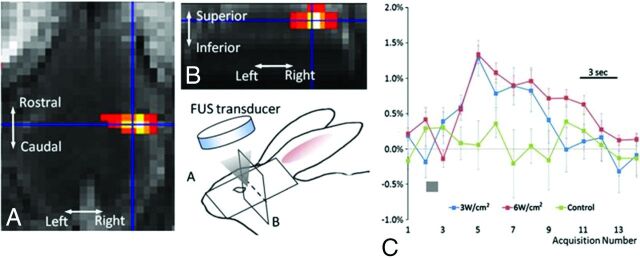
Fig 5.
Neuromodulation of the rabbit motor cortex. An fMRI activation map shows increased blood oxygen level–dependent–weighted signal in the right motor cortex (A and B). The blue crosshairs on the fMRI images correspond to the sonication focus. Cartoon schematic illustrates the experimental setup and spatial orientation. The graph (C) demonstrates the percentage of blood oxygen level–dependent signal change as a function of the time/acquisition number at 2 different FUS intensities: 6 W/cm2 (red curve) and 3 W/cm2 (blue curve). The green dataset represents the control group. The gray bars indicate the sonication time. Reprinted with permission from Yoo et al.28

