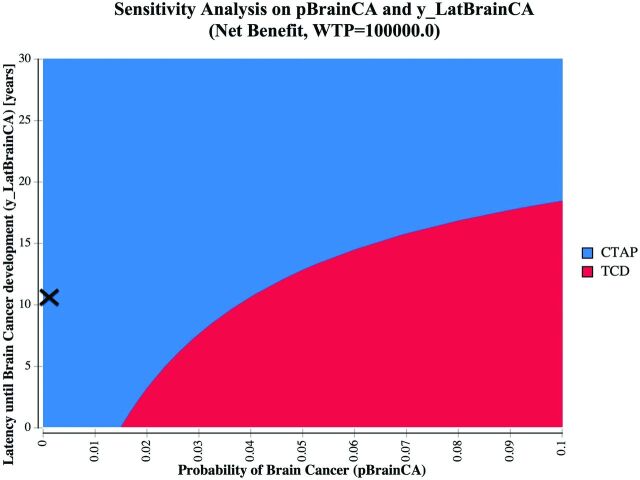
Fig 2.
Two-way sensitivity analysis on the probability of brain cancer and the latency of brain cancer overall in the patient population. The CTAP strategy is indicated in blue, and the TCD strategy is indicated in red. X denotes the base case (latency of brain cancer = 10.7 years based on published literature; modeled probability of brain cancer = 0.0002725; 95% CI, 0.000053–0.000802). A willingness-to-pay (WTP) threshold of $100,000 was assumed.

