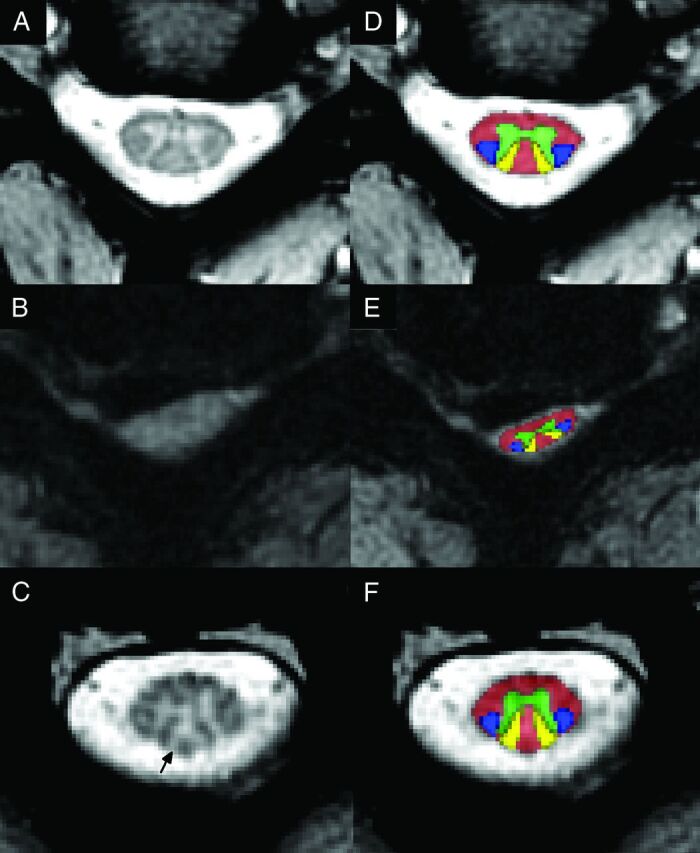
Fig 2.

T2*WI demonstrating loss of gray-white contrast and Wallerian degeneration. A, Axial T2*WI at C3–4 in a healthy subject shows strong contrast between GM and WM (T2*WI WM/GM = 0.791 for this image). B, T2*WI at C5–6 in a subject with severe DCM shows SC compression from a lateral disc herniation, with loss of gray-white contrast (T2*WI WM/GM = 0.967). C, T2*WI at C3 in the same subject with DCM shows focal hyperintensity (arrow) within the dorsal columns, suggesting Wallerian degeneration (T2*WI WM/GM = 0.923). D–F, The same images as in A–C with the Spinal Cord Toolbox probabilistic atlas representations of WM (red), GM (green), lateral corticospinal tracts (blue), and fasciculus cuneati (yellow) overlaid.
