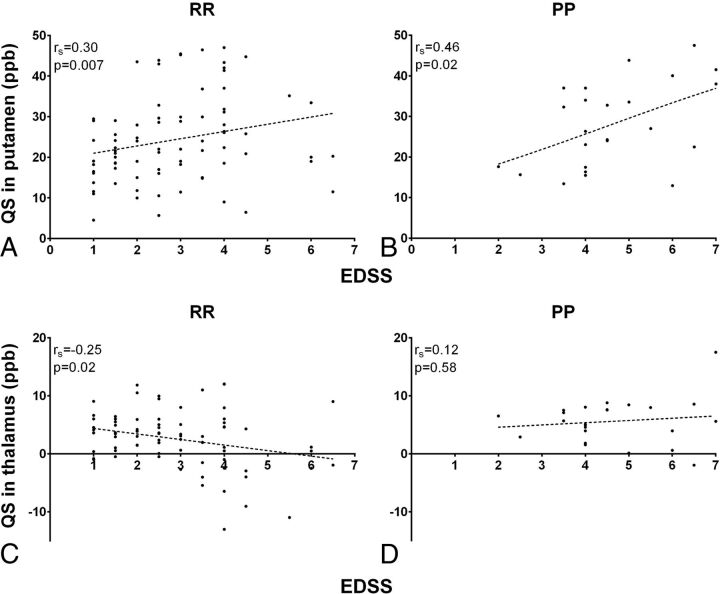
Fig 3.
The relationship between clinical disability and quantitative susceptibility values in the putamen and thalamus across PPMS and RRMS groups. X-axes indicate EDSS, while y-axes indicate quantitative susceptibility values in parts per billion. A positive correlation between EDSS and putaminal quantitative susceptibility values is present in both the RRMS (A) and PPMS (B) groups. In the thalamus, a negative correlation between EDSS and quantitative susceptibility is present only in the RRMS group (C), while no correlation is observed in the PPMS group (D).

